

Question: make sure answers is correct and show work with it make sure work is neat and organized S6.11: Twelve samples, each containing five parts, were
make sure answers is correct and show work with it make sure work is neat and organized 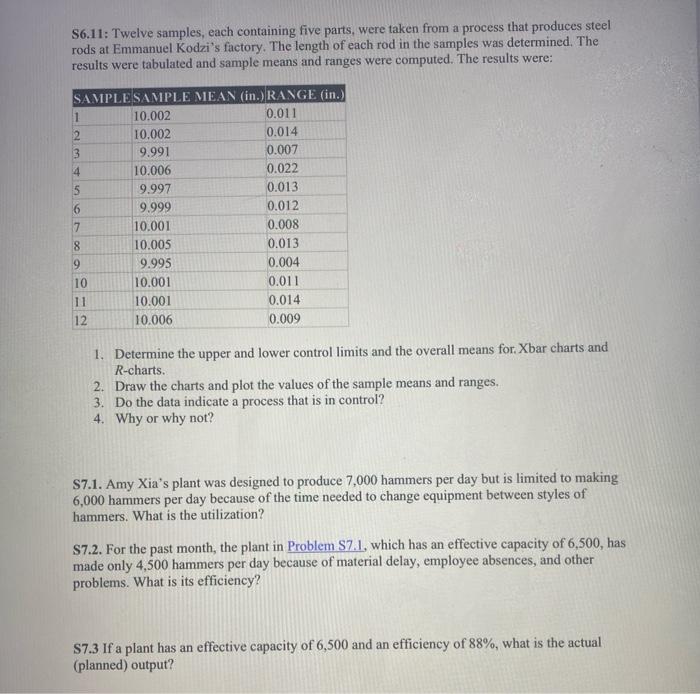
S6.11: Twelve samples, each containing five parts, were taken from a process that produces steel rods at Emmanuel Kodzi's factory. The length of each rod in the samples was determined. The results were tabulated and sample means and ranges were computed. The results were: 1. Determine the upper and lower control limits and the overall means for. Xbar charts and R-charts. 2. Draw the charts and plot the values of the sample means and ranges. 3. Do the data indicate a process that is in control? 4. Why or why not? S7.1. Amy Xia's plant was designed to produce 7,000 hammers per day but is limited to making 6,000 hammers per day because of the time needed to change equipment between styles of hammers. What is the utilization? S7.2. For the past month, the plant in Problem S7.1, which has an effective capacity of 6,500 , has made only 4,500 hammers per day because of material delay, employee absences, and other problems. What is its efficiency? S7.3 If a plant has an effective capacity of 6,500 and an efficiency of 88%, what is the actual (planned) output
Step by Step Solution
There are 3 Steps involved in it
1 Expert Approved Answer
Step: 1 Unlock

Question Has Been Solved by an Expert!
Get step-by-step solutions from verified subject matter experts
Step: 2 Unlock
Step: 3 Unlock