

Question: Manually create a data table exactly as shown in Table 1 into worksheet Prob1. You can format the cells manually (i.e., not via code) in
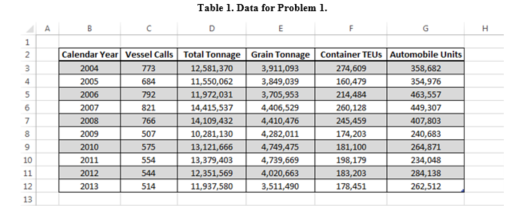
Manually create a data table exactly as shown in Table 1 into worksheet "Prob1". You can format the cells manually (i.e., not via code) in Excel. The upper left corner of Table 1 (i.e., the label "Calendar Year") should be entered in cell B2.
Table 1. Data for Problem 1
?.
SOLUTION REQUIREMENTS
Write a single sub procedure named Summary_Table that will process the data in Table 1 to create the summary table depicted in Figure 1.
Figure 1. Summary table
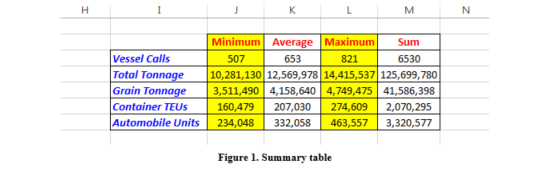
The Offset property MUST be used to position all the row and column labels in the summary data table (e.g., Vessel Calls and Minimum). You may use any cell in the worksheet "Prob1" as the base cell (i.e., 0th row and 0th column cell) when using the Offset property. The numerical values in the summary table can be positioned in the table using any Excel VBA property you deem appropriate.
The sub procedure Summary_Table must comply with the following formatting requirements of the summary table:
Row labels must be BOLD, Italic, BLUE, and left aligned.
Column labels must be BOLD, RED, and centered.
The interior color of every other column should be changed to improve readability. You are at liberty to pick the interior color. Note that Black and White are NOT acceptable colors to fulfill this requirement.
Borders around the cells must be created via code using a continuous line style and a thin weight.
The following formulas must be used to perform the calculations for each row category in the summary table (see Figure 1):
MIN
AVERAGE
MAX
SUM
The display of every column of the summary table (and corresponding formats) should occur with a delay of one second from each other. For example, once the procedure Summary_Table is executed, the display of the column that contains the row labels in the summary table (e.g., Vessel Calls, Total Tonnage, etc.), and corresponding formats should be displayed after one second. Then, another second must elapse before the data in the column labeled Minimum are displayed, and so on.
Column widths MUST adjust automatically to its contents after each column is displayed.
Range I2:M12 should be cleared automatically by your procedure immediately after the rectangular shape button is pressed.
You must use the WITH construct to make your code more readable.
Your sub procedure must end by selecting cell A1.
Assign the sub procedure Summary_Table to a rectangular shape button. The caption of the rectangular shape button should read Display Summary Table. The rectangular shape button should be visually appealing and its upper left corner should be aligned with the upper left corner of cell I10.
Step by Step Solution
There are 3 Steps involved in it

Get step-by-step solutions from verified subject matter experts