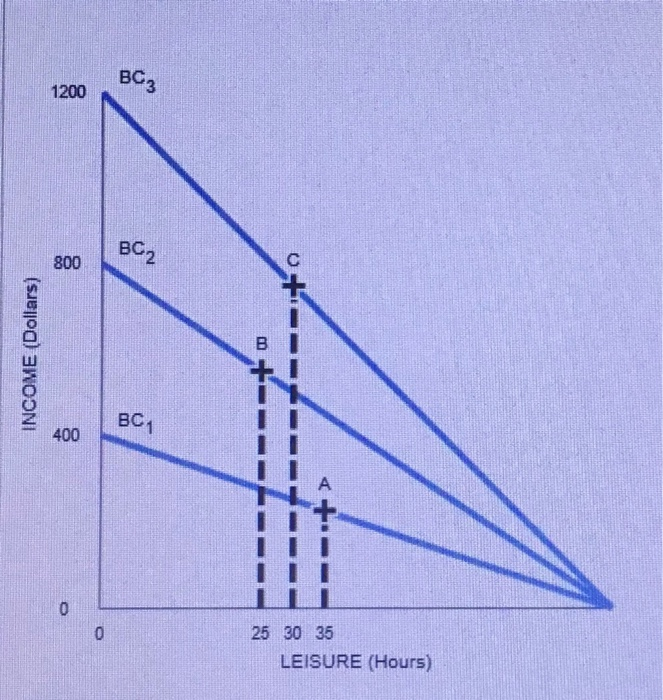
Question: Maria has 80 hours per week to devote to working or to leisure. She is paid an hourly wage and can work at her job

Maria has 80 hours per week to devote to working
Maria has 80 hours per week to devote to working or to leisure. She is paid an hourly wage and can work at her job as many hours a week as she likes. The following graph illustrates Maria's weekly income-leisure tradeoff. The three lines labeled BC BC), and BC, illustrate her time allocation budget at three different wages, points A, B, and show her optimal time allocation choices along each of these constraints. BC3 1200 BC2 800 INCOME (Dollars) 400 BC, TH 25 30 35 LEISURE (Hours) per week Maria will spend during leisure activities versus working Wage (Dollars per hour) Leisure (Hours) Labor (Hours) Point Based on the data you entered in the preceding table, use the orange curve (square symbols) to plot Maria's labor supply curve on the following graph, showing how much labor she supplies each week at each of the three wages Labor Supply WAGE (Dollars per hour) LABOR (Hours) to Suppose that Maria's initial budget line was BC, and that it then changed to BC therefore, Maria's optimal time allocation choice shifted from C. As a result of this change, Maria's opportunity cost of leisure and she chose to consume leisure. Consequently, in this effect dominates the effect. The corresponding portion of Maria's labor supply curveis

Step by Step Solution

There are 3 Steps involved in it

1 Expert Approved Answer
Step: 1 Unlock blur-text-image
Question Has Been Solved by an Expert!

Get step-by-step solutions from verified subject matter experts

Step: 2 Unlock
Step: 3 Unlock

Students Have Also Explored These Related General Management Questions!