

Question: Marks Scatter Plot 3. h at right, TTU a) draw a line of best fit (LOBF). /1 100 b) pick two points on the LoBF.
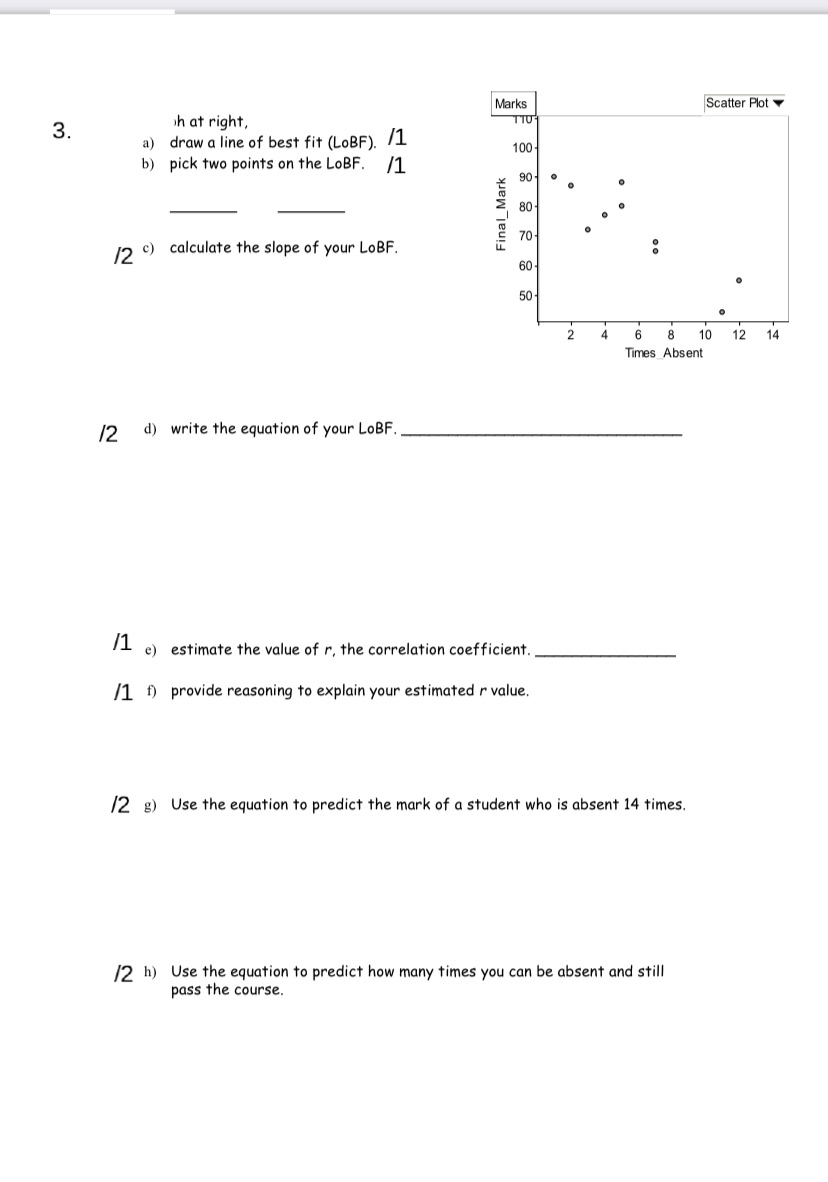
Marks Scatter Plot 3. h at right, TTU a) draw a line of best fit (LOBF). /1 100 b) pick two points on the LoBF. /1 90 80 Final_Mark 70 /2 ") calculate the slope of your LOBF. 0 0 60 50 6 8 10 12 14 Times_Absent /2 d) write the equation of your LOBF. /1 e) estimate the value of r, the correlation coefficient. (1 1) provide reasoning to explain your estimated r value. (2 g) Use the equation to predict the mark of a student who is absent 14 times. (2 h) Use the equation to predict how many times you can be absent and still pass the course
Step by Step Solution
There are 3 Steps involved in it
1 Expert Approved Answer
Step: 1 Unlock

Question Has Been Solved by an Expert!
Get step-by-step solutions from verified subject matter experts
Step: 2 Unlock
Step: 3 Unlock