

Question: Mass (g) Force (N ) Stretch (m) 50 0.490 0.0600 75 100 125 150 175 200 225 250 275 300 From the data table and
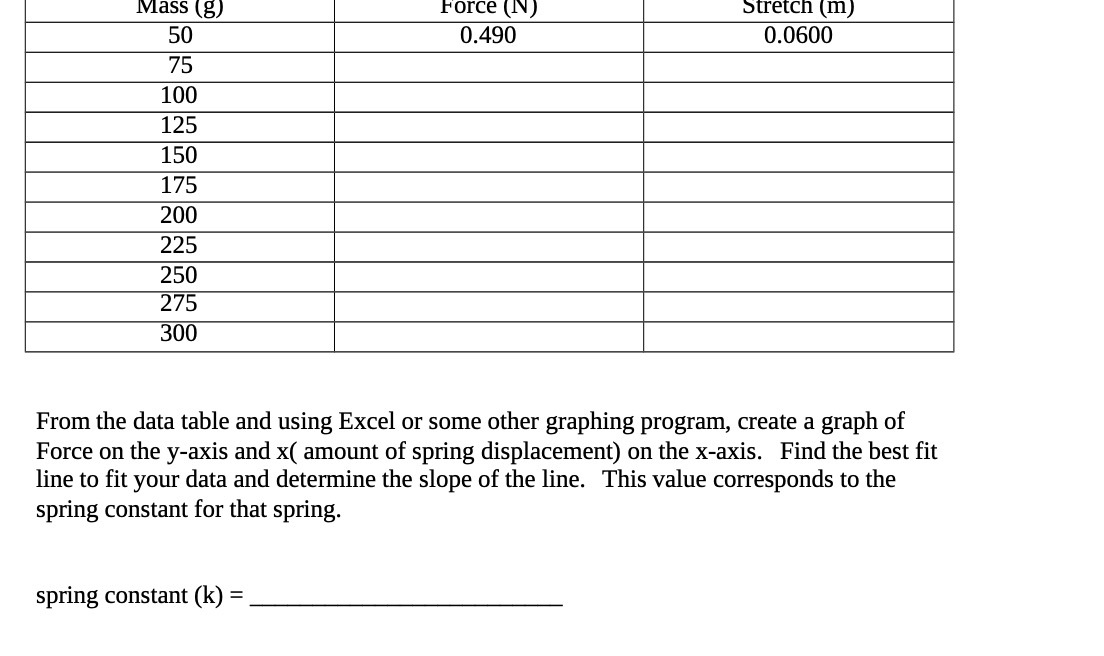

Mass (g) Force (N ) Stretch (m) 50 0.490 0.0600 75 100 125 150 175 200 225 250 275 300 From the data table and using Excel or some other graphing program, create a graph of Force on the y-axis and x( amount of spring displacement) on the x-axis. Find the best fit line to fit your data and determine the slope of the line. This value corresponds to the spring constant for that spring. spring constant (k) =
Step by Step Solution
There are 3 Steps involved in it
1 Expert Approved Answer
Step: 1 Unlock

Question Has Been Solved by an Expert!
Get step-by-step solutions from verified subject matter experts
Step: 2 Unlock
Step: 3 Unlock