

Question: Match the correct description to the correct tool A digram used to seach for the cause ( s ) of a problem ( also known
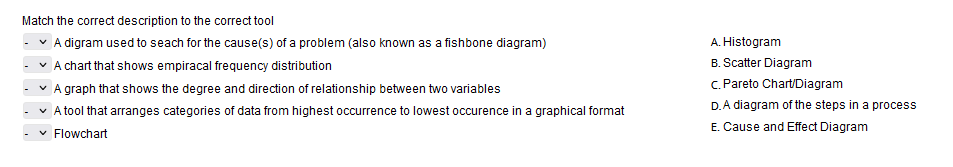
Match the correct description to the correct tool
A digram used to seach for the causes of a problem also known as a fishbone diagram
A Histogram
A chart that shows empiracal frequency distribution
B Scatter Diagram
A graph that shows the degree and direction of relationship between two variables
C Pareto ChartDiagram
A tool that arranges categories of data from highest occurrence to lowest occurence in a graphical format
D A diagram of the steps in a process
Flowchart
E Cause and Effect Diagram
Step by Step Solution
There are 3 Steps involved in it
1 Expert Approved Answer
Step: 1 Unlock

Question Has Been Solved by an Expert!
Get step-by-step solutions from verified subject matter experts
Step: 2 Unlock
Step: 3 Unlock