

Question: Math, statistics 22. 0 Another car The correlation between a car's engine size and its fuel economy {in mpg] is r = t].?'i4. I|.Ilihat traction
Math, statistics
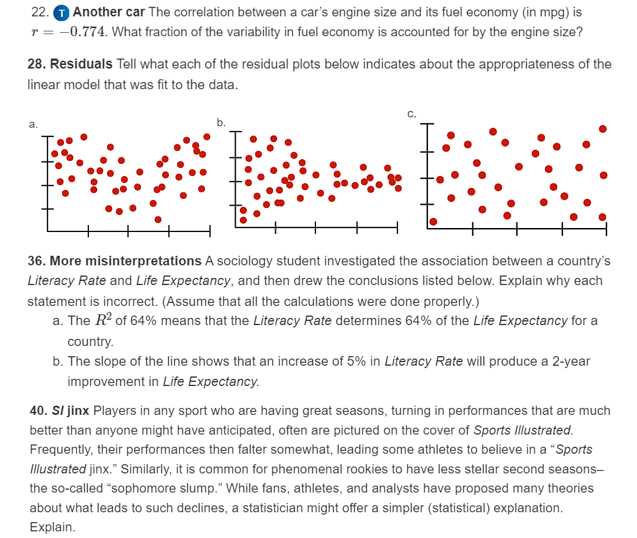
![size and its fuel economy {in mpg] is r = t].?'i"4. I|.I"lihat](https://dsd5zvtm8ll6.cloudfront.net/si.experts.images/questions/2024/09/66ef183157cef_32966ef1831380ab.jpg)
22. 0 Another car The correlation between a car's engine size and its fuel economy {in mpg] is r = t].?'i"4. I|.I"lihat traction of the variability in fuel economy is accounted for by the engine size? 23. Residuals Tell what each of the residual plots below indicates about the appropriateness ofthe linear model that was fit to the data. 35. More mlslnterpretatlonsa sociology student investigated the association between a country's Literacy Rate and Life Expectancy. and then drew the conclusions listed below. Explain why each statement is incorrect. {Aume that all the calculations were done properly.) a. The R2 of 54% means that the Literacy Rate determines 64% of the Life Expectancy for a country. b. The slope of the line shows that an increase of 5% in Literacy Here will produce a 2-year improvement in Life Expectancy: It}. Sillm: Players in any sport who are having great seasons, turning in performances that are much better than anyone might have anticipated. often are pictured on the cover of Sports illustrated. Frequently. their performances then falter somewhat. leading some athletes to believe in a \"Sports iiiustrated jinx." Similarly. it is common for phenomenal rookies to have less stellar second season 5 the so-called \"sophomore slump.\" 1ll'lihile tans. athletes. and analysts have proposed many theories about what leads to such declines. a statistician might offer a simpler {statistical} explanation. Explain. 46. 0 Attendance 211116, revisited Consider again the regression of Home Average Attendance on Runs for the baseball teams examined in Exercise MEI. a. What is the correlation between Runs and Home Average Attendance? b. What would you predict about the Home Average Attendance for a team that is 2 standard deviations above average in Runs? c. If a team is 1 standard deviation below average in attendance. what would you predict about the number of ans the team has scored? 54. Success in college Colleges use SAT scores in the admissions process because they believe these scores provide some insight into how a high school student will perform at the college level. Suppose the entering freshmen at a certain college have mean combined SAT Scores of 1222. with a standard deviation of 123. In the rst semester, these students attained a mean GPA of 2.55, with a standard deviation of 0.56. A scatterplot showed the association to be reasonably linear. and the correlation between SAT score and GPA was g_4?_ a. Write the equation of the regression line. b. Explain what the yinteroept of the regression line indicates. c. Interpret the slope of the regression line. d. Predict the GPA ofa freshmen who scored a combined 14cc. e. Based upon these statistics, how effective do you think SAT scores would be in predicting academic success during the rst semester of the freshman year at this college? Explain. i. As a student. would you rather have a positive or a negative residual in this context? Explain
Step by Step Solution
There are 3 Steps involved in it

Get step-by-step solutions from verified subject matter experts