

Question: Mathematica Part 4 Surface of Revolution: Revolution Plot3D -- Create a plot of revfct over [revDomainStart, revDomainEnd] as defined below See the MM tutorial from
Mathematica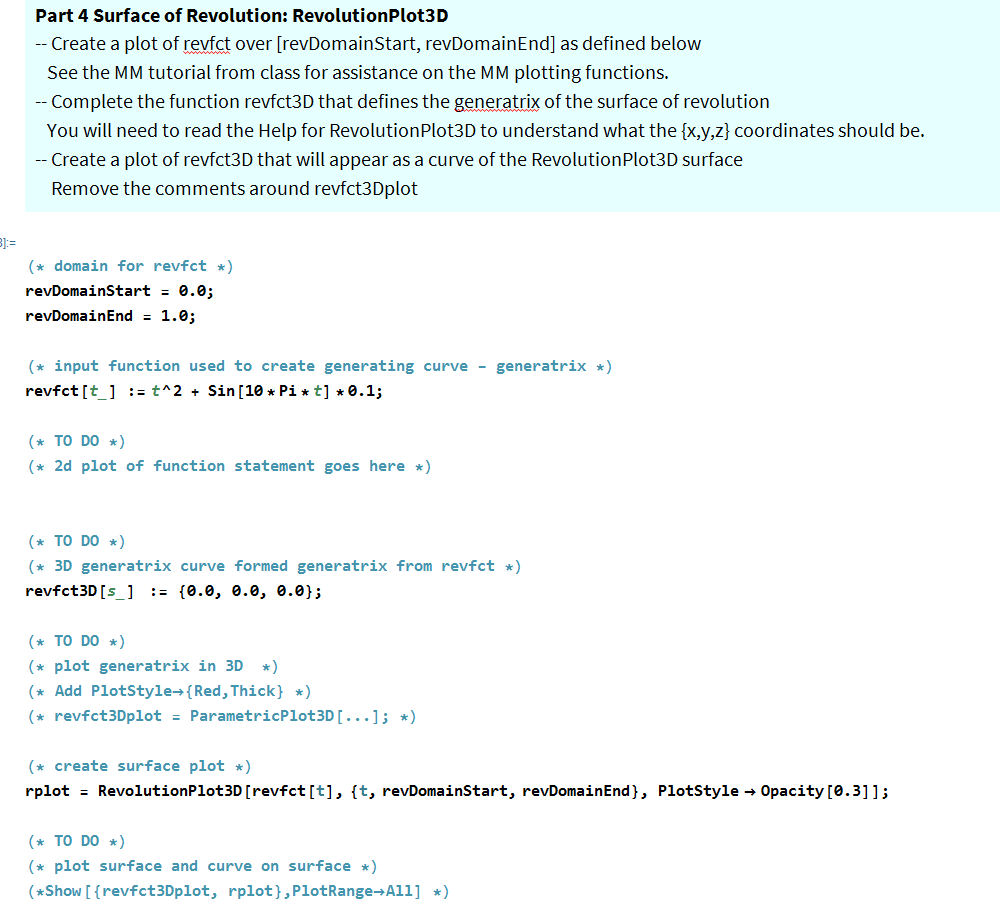
Part 4 Surface of Revolution: Revolution Plot3D -- Create a plot of revfct over [revDomainStart, revDomainEnd] as defined below See the MM tutorial from class for assistance on the MM plotting functions. -- Complete the function revfct3D that defines the generatrix of the surface of revolution You will need to read the Help for Revolution Plot3D to understand what the {x,y,z} coordinates should be. -- Create a plot of revfct3D that will appear as a curve of the Revolution Plot3D surface Remove the comments around revfct3Dplot (* domain for revfct *) revDomainStart = 0.0; revDomainEnd = 1.0; (* input function used to create generating curve - generatrix *) revfct[t] := t^2 + Sin[10* Pi* t] +0.1; (* TO DO *) (* 2d plot of function statement goes here *) (* TO DO *) (* 3D generatrix curve formed generatrix from revfct *) revfct3D[s_] := {0.0, 0.0, 0.0}; (* TO DO *) (* plot generatrix in 3D *) (* Add PlotStyle={Red, Thick} *) (* revfct3Dplot = ParametricPlot3D [...]; *) (* create surface plot *) rplot = RevolutionPlot 3D [revfct[t], {t, revDomainStart, revDomainEnd), PlotStyle Opacity [0.3]]; (* TO DO *) (* plot surface and curve on surface *) (*Show[{revfct3Dplot, rplot), PlotRange-A11] *) Part 4 Surface of Revolution: Revolution Plot3D -- Create a plot of revfct over [revDomainStart, revDomainEnd] as defined below See the MM tutorial from class for assistance on the MM plotting functions. -- Complete the function revfct3D that defines the generatrix of the surface of revolution You will need to read the Help for Revolution Plot3D to understand what the {x,y,z} coordinates should be. -- Create a plot of revfct3D that will appear as a curve of the Revolution Plot3D surface Remove the comments around revfct3Dplot (* domain for revfct *) revDomainStart = 0.0; revDomainEnd = 1.0; (* input function used to create generating curve - generatrix *) revfct[t] := t^2 + Sin[10* Pi* t] +0.1; (* TO DO *) (* 2d plot of function statement goes here *) (* TO DO *) (* 3D generatrix curve formed generatrix from revfct *) revfct3D[s_] := {0.0, 0.0, 0.0}; (* TO DO *) (* plot generatrix in 3D *) (* Add PlotStyle={Red, Thick} *) (* revfct3Dplot = ParametricPlot3D [...]; *) (* create surface plot *) rplot = RevolutionPlot 3D [revfct[t], {t, revDomainStart, revDomainEnd), PlotStyle Opacity [0.3]]; (* TO DO *) (* plot surface and curve on surface *) (*Show[{revfct3Dplot, rplot), PlotRange-A11] *)
Step by Step Solution
There are 3 Steps involved in it

Get step-by-step solutions from verified subject matter experts