

Question: MATLAB 3. Create a semi-log plot of the function y-10 log( 2) where c = 10. In the above formula, log() is the common logarithm
MATLAB
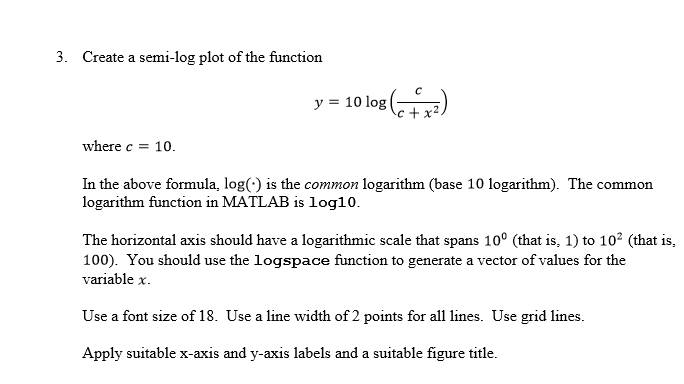
3. Create a semi-log plot of the function y-10 log( 2) where c = 10. In the above formula, log() is the common logarithm (base 10 logarithm). The common logarithm function in MATLAB is log10. The horizontal axis should have a logarithmic scale that spans 10 (that is, 1) to 102 (that is, 100). You should use the logspace function to generate a vector of values for the variable x Use a font size of 18. Use a line width of 2 points for all lines. Use grid lines. Apply suitable x-axis and y-axis labels and a suitable figure title
Step by Step Solution
There are 3 Steps involved in it
1 Expert Approved Answer
Step: 1 Unlock

Question Has Been Solved by an Expert!
Get step-by-step solutions from verified subject matter experts
Step: 2 Unlock
Step: 3 Unlock