

Question: matlab 31. Use the data from Problem 30 for the following (a) Fit the data with linear interpolation. Estimate the concentration at t - 2.25.
matlab
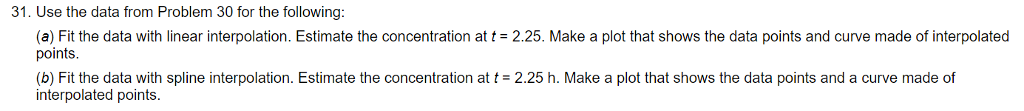
31. Use the data from Problem 30 for the following (a) Fit the data with linear interpolation. Estimate the concentration at t - 2.25. Make a plot that shows the data points and curve made of interpolated points (b) Fit the data with spline interpolation. Estimate the concentration at t 2.25 h. Make a plot that shows the data points and a curve made of interpolated points. 31. Use the data from Problem 30 for the following (a) Fit the data with linear interpolation. Estimate the concentration at t - 2.25. Make a plot that shows the data points and curve made of interpolated points (b) Fit the data with spline interpolation. Estimate the concentration at t 2.25 h. Make a plot that shows the data points and a curve made of interpolated points
Step by Step Solution
There are 3 Steps involved in it

Get step-by-step solutions from verified subject matter experts