

Question: MATLAB and flowchart for the function you're creating in MATLAB Exercise 3 T (a) Create a flow chart for the Newton-Raphson method that uses a
MATLAB and flowchart for the function you're creating in MATLAB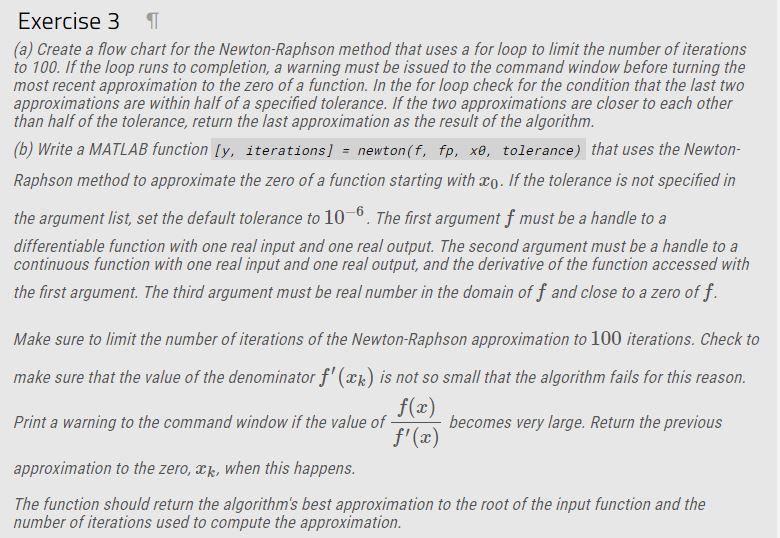
Exercise 3 T (a) Create a flow chart for the Newton-Raphson method that uses a for loop to limit the number of iterations to 100. If the loop runs to completion, a warning must be issued to the command window before turning the most recent approximation to the zero of a function. In the for loop check for the condition that the last two approximations are within half of a specified tolerance. If the two approximations are closer to each other than half of the tolerance, return the last approximation as the result of the algorithm. (b) Write a MATLAB function [y, iterations] - newton(f, fp, xo, tolerance) that uses the Newton- Raphson method to approximate the zero of a function starting with Xo. If the tolerance is not specified in the argument list, set the default tolerance to 10-6. The first argument f must be a handle to a differentiable function with one real input and one real output. The second argument must be a handle to a continuous function with one real input and one real output, and the derivative of the function accessed with the first argument. The third argument must be real number in the domain of f and close to a zero off. Make sure to limit the number of iterations of the Newton-Raphson approximation to 100 iterations. Check to make sure that the value of the denominator f'(xx) is not so small that the algorithm fails for this reason. f(x) Print a warning to the command window if the value of becomes very large. Return the previous f'(x) approximation to the zero, Ik, when this happens. The function should return the algorithm's best approximation to the root of the input function and the number of iterations used to compute the approximation
Step by Step Solution
There are 3 Steps involved in it

Get step-by-step solutions from verified subject matter experts