

Question: MATLAB code. I'm just having trouble understanding the commands for these operations. I DO give thumbs up for correct work! Using the plot command, plot
MATLAB code. I'm just having trouble understanding the commands for these operations. I DO give thumbs up for correct work!
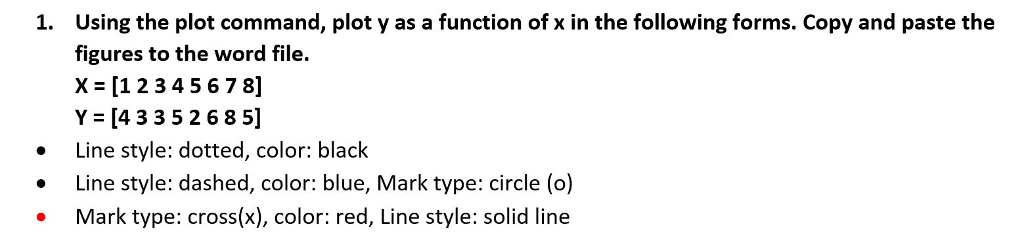
Using the plot command, plot y as a function of x in the following forms. Copy and paste the figures to the word file. X-[12345 6 7 8] Y [4 3 3 5 26 8 5] 1. . Line style: dotted, color: black Line style: dashed, color: blue, Mark type: circle (o) Mark type: cross(x), color: red, Line style: solid line
Step by Step Solution
There are 3 Steps involved in it
1 Expert Approved Answer
Step: 1 Unlock

Question Has Been Solved by an Expert!
Get step-by-step solutions from verified subject matter experts
Step: 2 Unlock
Step: 3 Unlock