

Question: MATLAB CODE ONLY! Consider the following exponentially decaying continuous signal: f(t)=eat for a>0 Task 1 Plot f(t) [5%] (a) Write a code to plot f(t),5t5,
MATLAB CODE ONLY! 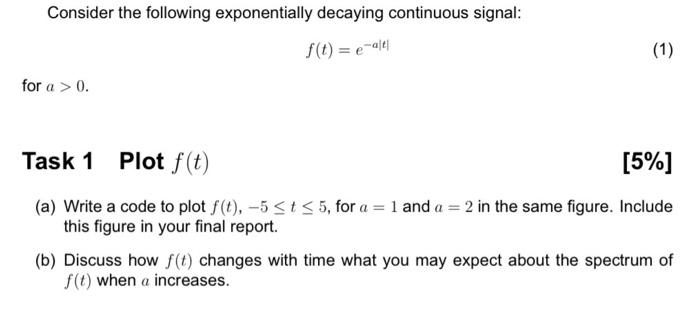
Consider the following exponentially decaying continuous signal: f(t)=eat for a>0 Task 1 Plot f(t) [5%] (a) Write a code to plot f(t),5t5, for a=1 and a=2 in the same figure. Include this figure in your final report. (b) Discuss how f(t) changes with time what you may expect about the spectrum of f(t) when a increases
Step by Step Solution
There are 3 Steps involved in it
1 Expert Approved Answer
Step: 1 Unlock

Question Has Been Solved by an Expert!
Get step-by-step solutions from verified subject matter experts
Step: 2 Unlock
Step: 3 Unlock