

Question: MATLAB, TASK 2 Consider the following exponentially decaying continuous signal: f(t)=eat for a>0. Task 1 Plot f(t) [5%] (a) Write a code to plot f(t),5t5,
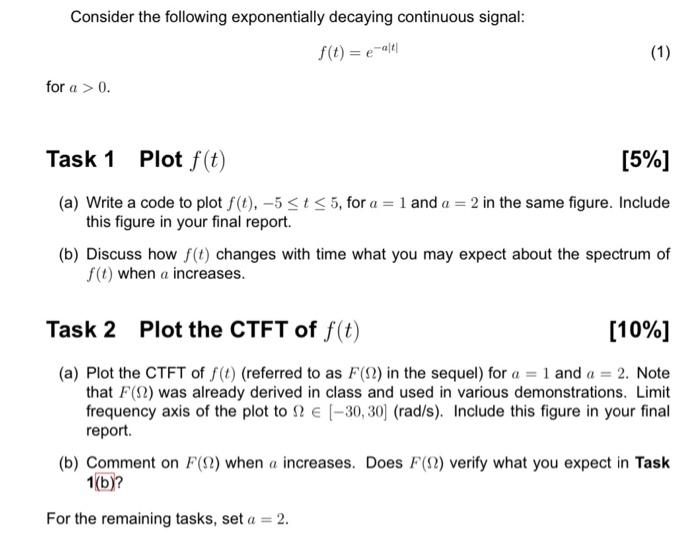
Consider the following exponentially decaying continuous signal: f(t)=eat for a>0. Task 1 Plot f(t) [5%] (a) Write a code to plot f(t),5t5, for a=1 and a=2 in the same figure. Include this figure in your final report. (b) Discuss how f(t) changes with time what you may expect about the spectrum of f(t) when a increases. Task 2 Plot the CTFT of f(t) [10%] (a) Plot the CTFT of f(t) (referred to as F() in the sequel) for a=1 and a=2. Note that F() was already derived in class and used in various demonstrations. Limit frequency axis of the plot to [30,30](rad/s). Include this figure in your final report. (b) Comment on F() when a increases. Does F() verify what you expect in Task 1(b)? For the remaining tasks, set a=2
Step by Step Solution
There are 3 Steps involved in it

Get step-by-step solutions from verified subject matter experts