Question: matlab code please Points) Function Name: manySquares Input (1): The number of pixels per square (2): The filename of a .png image Plot Output: A
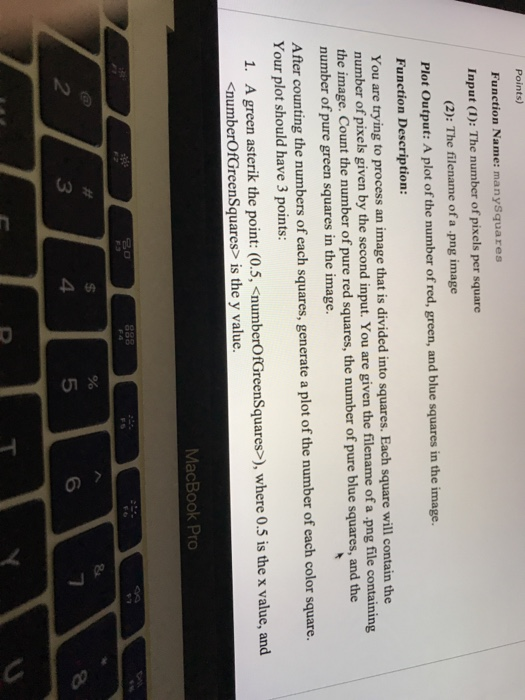
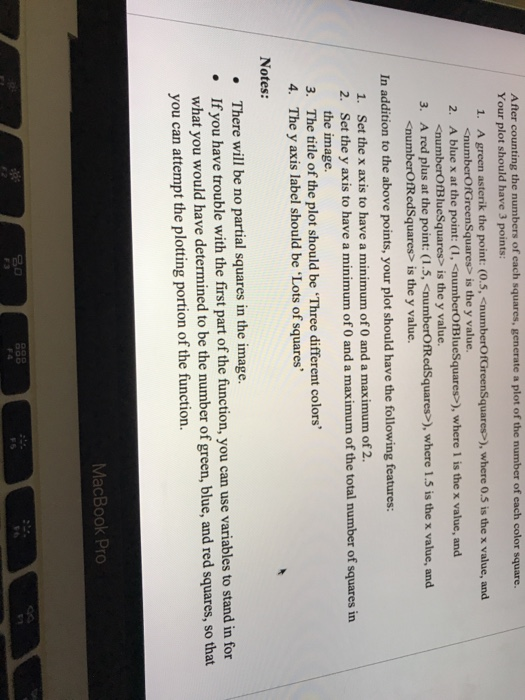
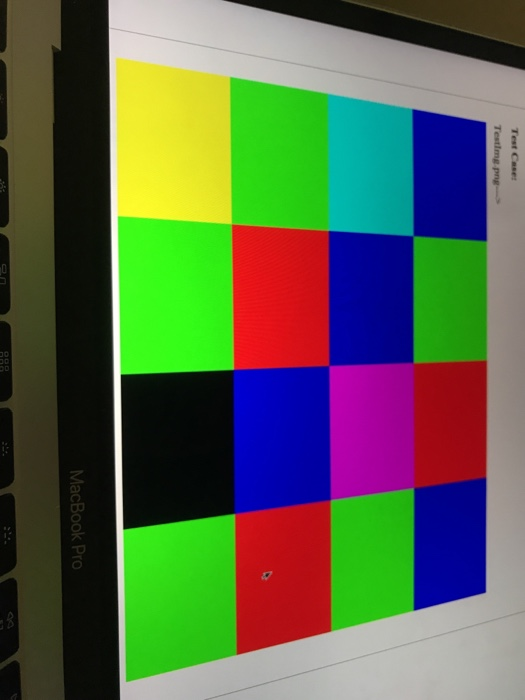
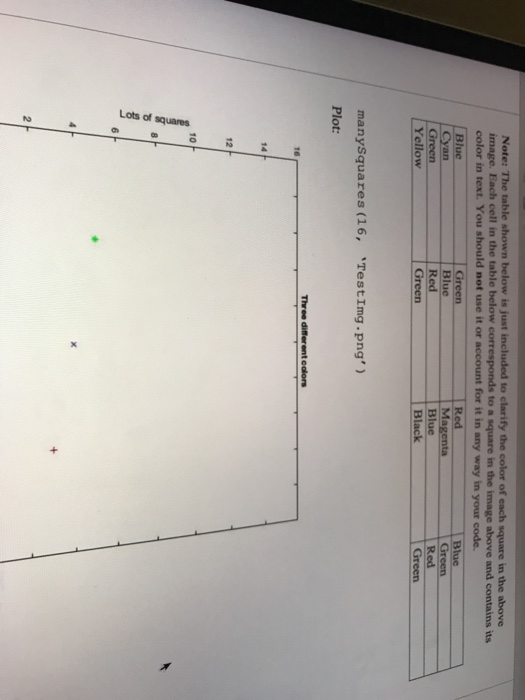
Points) Function Name: manySquares Input (1): The number of pixels per square (2): The filename of a .png image Plot Output: A plot of the number of red, green, and blue squares in the image. Function Description: You are trying to process an image that is divided into squares. Each square will contain the number of pixels given by the second input. You are given the filename of a .png file containing the image. Count the number of pure red squares, the number of pure blue squares, and the number of pure green squares in the image. After counting the numbers of each squares, generate a plot of the number of each color square. Your plot should have 3 points: 1. A green asterik the point: (0.5, is the y value. MacBook Pro 888 $ 4 % 5 6 7 2 3 After counting the numbers of each squares, generate a plot of the number of each color square. Your plot should have 3 points: 1. A green asterik the point: (0.5, is the y value. 2. A blue x at the point: (1, is the y value. 3. A red plus at the point: (1.5, ), where 1.5 is the x value, and is the y value. In addition to the above points, your plot should have the following features: 1. Set the x axis to have a minimum of 0 and a maximum of 2. 2. Set the y axis to have a minimum of 0 and a maximum of the total number of squares in the image. 3. The title of the plot should be 'Three different colors' 4. The y axis label should be 'Lots of squares' Notes: There will be no partial squares in the image. If you have trouble with the first part of the function, you can use variables to stand in for what you would have determined to be the number of green, blue, and red squares, so that you can attempt the plotting portion of the function. MacBook Pro DOD Test Caser Testimg.png MacBook Pro Note: The table shown below is just included to clarify the color of each square in the above image. Each cell in the table below corresponds to a square in the image above and contains its color in text. You should not use it or account for it in any way in your code. Blue Green Red Blus Cyan Blue Magenta Green Green Red Blue Red Yellow Green Black Green manySquares (16, TestImg.png') Plot: Three different colors 16 14 12 10 sarenbsp 507 2 Points) Function Name: manySquares Input (1): The number of pixels per square (2): The filename of a .png image Plot Output: A plot of the number of red, green, and blue squares in the image. Function Description: You are trying to process an image that is divided into squares. Each square will contain the number of pixels given by the second input. You are given the filename of a .png file containing the image. Count the number of pure red squares, the number of pure blue squares, and the number of pure green squares in the image. After counting the numbers of each squares, generate a plot of the number of each color square. Your plot should have 3 points: 1. A green asterik the point: (0.5, is the y value. MacBook Pro 888 $ 4 % 5 6 7 2 3 After counting the numbers of each squares, generate a plot of the number of each color square. Your plot should have 3 points: 1. A green asterik the point: (0.5, is the y value. 2. A blue x at the point: (1, is the y value. 3. A red plus at the point: (1.5, ), where 1.5 is the x value, and is the y value. In addition to the above points, your plot should have the following features: 1. Set the x axis to have a minimum of 0 and a maximum of 2. 2. Set the y axis to have a minimum of 0 and a maximum of the total number of squares in the image. 3. The title of the plot should be 'Three different colors' 4. The y axis label should be 'Lots of squares' Notes: There will be no partial squares in the image. If you have trouble with the first part of the function, you can use variables to stand in for what you would have determined to be the number of green, blue, and red squares, so that you can attempt the plotting portion of the function. MacBook Pro DOD Test Caser Testimg.png MacBook Pro Note: The table shown below is just included to clarify the color of each square in the above image. Each cell in the table below corresponds to a square in the image above and contains its color in text. You should not use it or account for it in any way in your code. Blue Green Red Blus Cyan Blue Magenta Green Green Red Blue Red Yellow Green Black Green manySquares (16, TestImg.png') Plot: Three different colors 16 14 12 10 sarenbsp 507 2