

Question: MATLAB CODE: You have a program that has a defined vector X: X = -20: 0.1: 20; How to sample functions f(x) = 1 x
MATLAB CODE: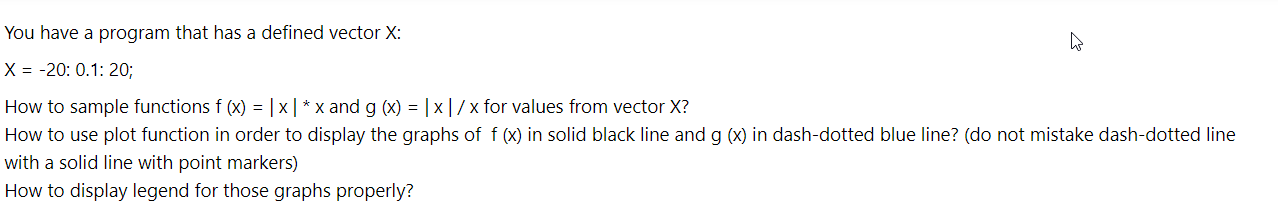
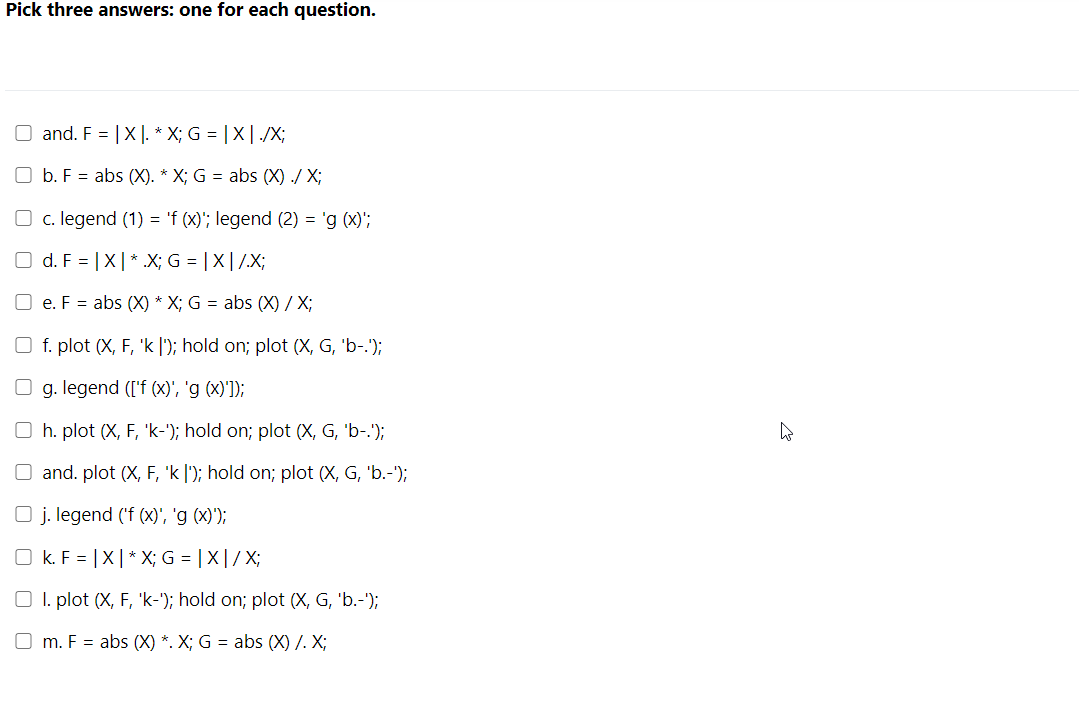
You have a program that has a defined vector X: X = -20: 0.1: 20; How to sample functions f(x) = 1 x 1 * x and g(x) = |x|/ x for values from vector X? How to use plot function in order to display the graphs of f(x) in solid black line and g (x) in dash-dotted blue line? (do not mistake dash-dotted line with a solid line with point markers) How to display legend for those graphs properly? Pick three answers: one for each question. O and. F = X]. * X; G = [X./X; O b. F = abs(X). * X; G = abs(X)./ X; c. legend (1) = 'f (x)'; legend (2) = 'g (x)"; O d. F = [X || X; G = | X1/X; e. F = abs(X) * X; G = abs(X)/X; f. plot (X, F, 'k []); hold on; plot (X, G, 'b-.'); O g. legend (['f (x), 'g (x)']); Oh. plot (X, F, 'k-"); hold on; plot (X, G, 'b-.'); and.plot(X, F, 'k 1); hold on; plot (X, G, 'b.-"); j. legend ('f(x)', 'g (x)'); Ok. F = 1 X*X; G = [X1/X; Ol.plot(X, F, 'k-"); hold on; plot (X, G, 'b.-'); m. F = abs(X) *.X; G = abs(X) /.X; You have a program that has a defined vector X: X = -20: 0.1: 20; How to sample functions f(x) = 1 x 1 * x and g(x) = |x|/ x for values from vector X? How to use plot function in order to display the graphs of f(x) in solid black line and g (x) in dash-dotted blue line? (do not mistake dash-dotted line with a solid line with point markers) How to display legend for those graphs properly? Pick three answers: one for each question. O and. F = X]. * X; G = [X./X; O b. F = abs(X). * X; G = abs(X)./ X; c. legend (1) = 'f (x)'; legend (2) = 'g (x)"; O d. F = [X || X; G = | X1/X; e. F = abs(X) * X; G = abs(X)/X; f. plot (X, F, 'k []); hold on; plot (X, G, 'b-.'); O g. legend (['f (x), 'g (x)']); Oh. plot (X, F, 'k-"); hold on; plot (X, G, 'b-.'); and.plot(X, F, 'k 1); hold on; plot (X, G, 'b.-"); j. legend ('f(x)', 'g (x)'); Ok. F = 1 X*X; G = [X1/X; Ol.plot(X, F, 'k-"); hold on; plot (X, G, 'b.-'); m. F = abs(X) *.X; G = abs(X) /.X
Step by Step Solution
There are 3 Steps involved in it

Get step-by-step solutions from verified subject matter experts