

Question: You have a program that has a defined vector X: X = -20:0.1:20; How to sample functions f(x)= x*x and g(x)= xl/x for values from
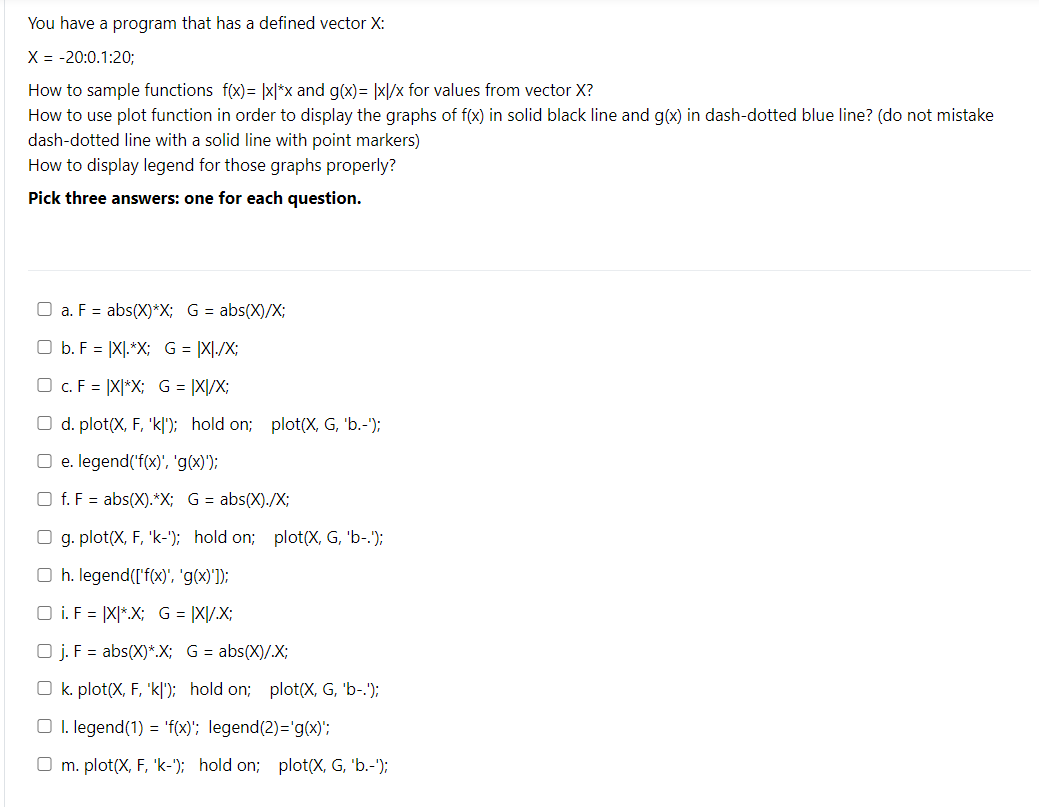
You have a program that has a defined vector X: X = -20:0.1:20; How to sample functions f(x)= x*x and g(x)= xl/x for values from vector X? How to use plot function in order to display the graphs of f(x) in solid black line and g(x) in dash-dotted blue line? (do not mistake dash-dotted line with a solid line with point markers) How to display legend for those graphs properly? Pick three answers: one for each question. O a. F = abs(X)*X; G = abs(X)/X; b. F = [X].*X; G = [X]./X; O c. F = [XI*X; G = [X]/X; d.plot(X, F, 'k]'; hold on; plot(X, G, 'b.-'); O e. legend('f(x)', 'g(x)'); Of. F = abs(X).*X; G = abs(X)./X; O g. plot(X, F, 'k-"); hold on; plot(X, G, 'b-'); Oh. legend(['f(x)', 'g(x)']); i. F = [X*X; G = [X]/.X; Oj. F = abs(X)*X; G = abs(X)/.X; Ok.plot(X, F, 'k'); hold on; plot(X, G, 'b-.'); O I. legend(1) = 'f(x)'; legend(2)='g(x)'; m.plot(X, F, 'k-'); hold on; plot(X, G, 'b.-")
Step by Step Solution
There are 3 Steps involved in it

Get step-by-step solutions from verified subject matter experts