

Question: MATLAB Complete the MATLAB script to obtain the step, impulse, and frequency response for a first order system and a second order system with three


MATLAB
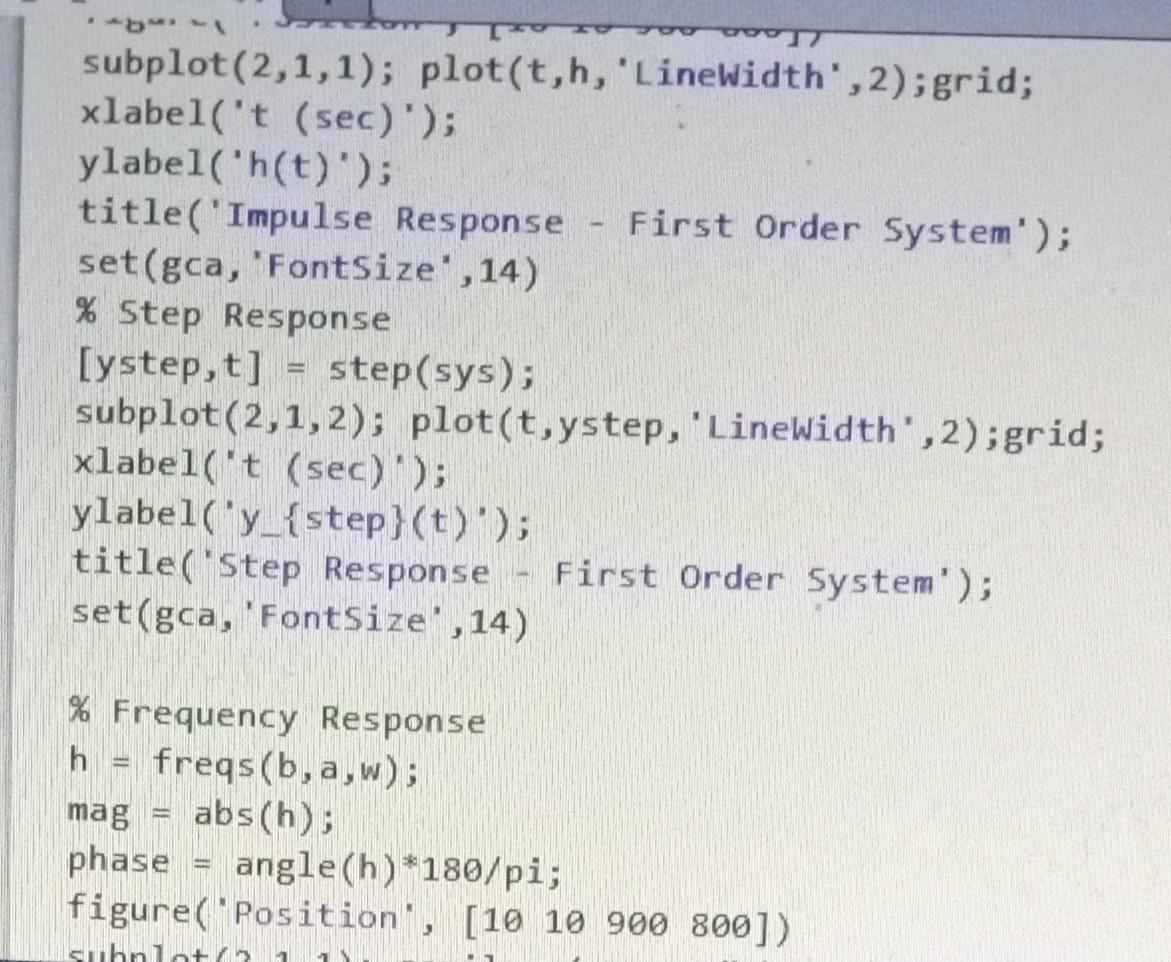
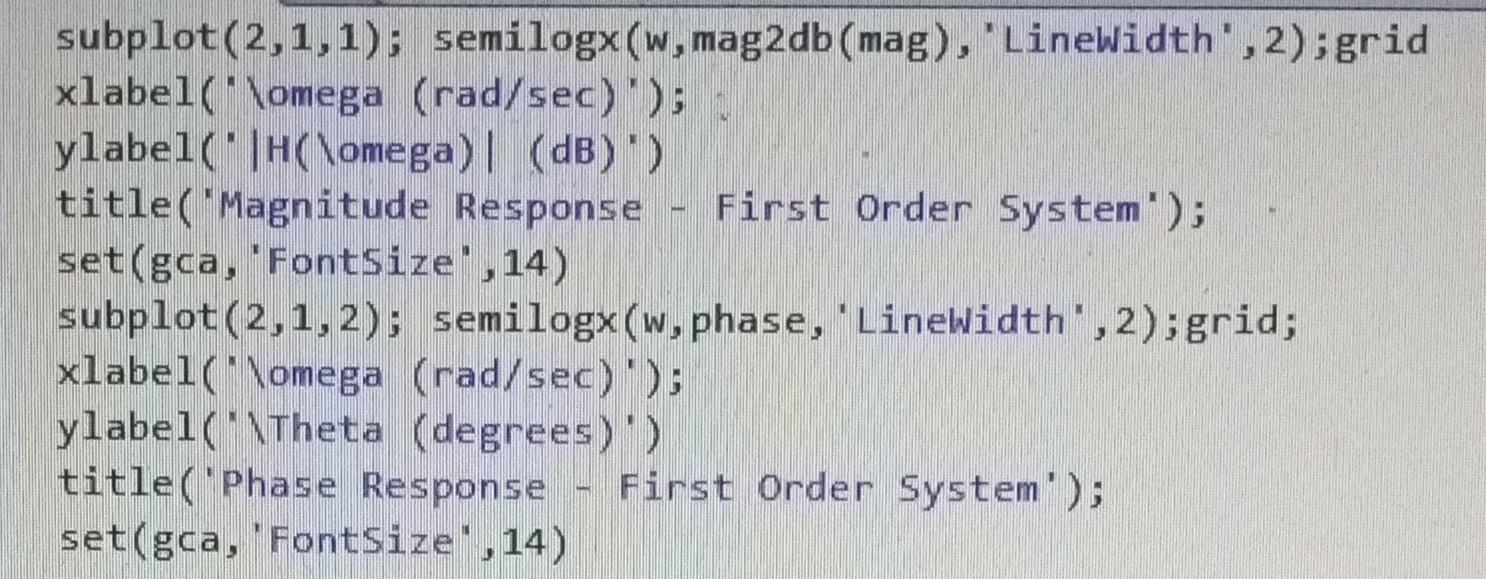
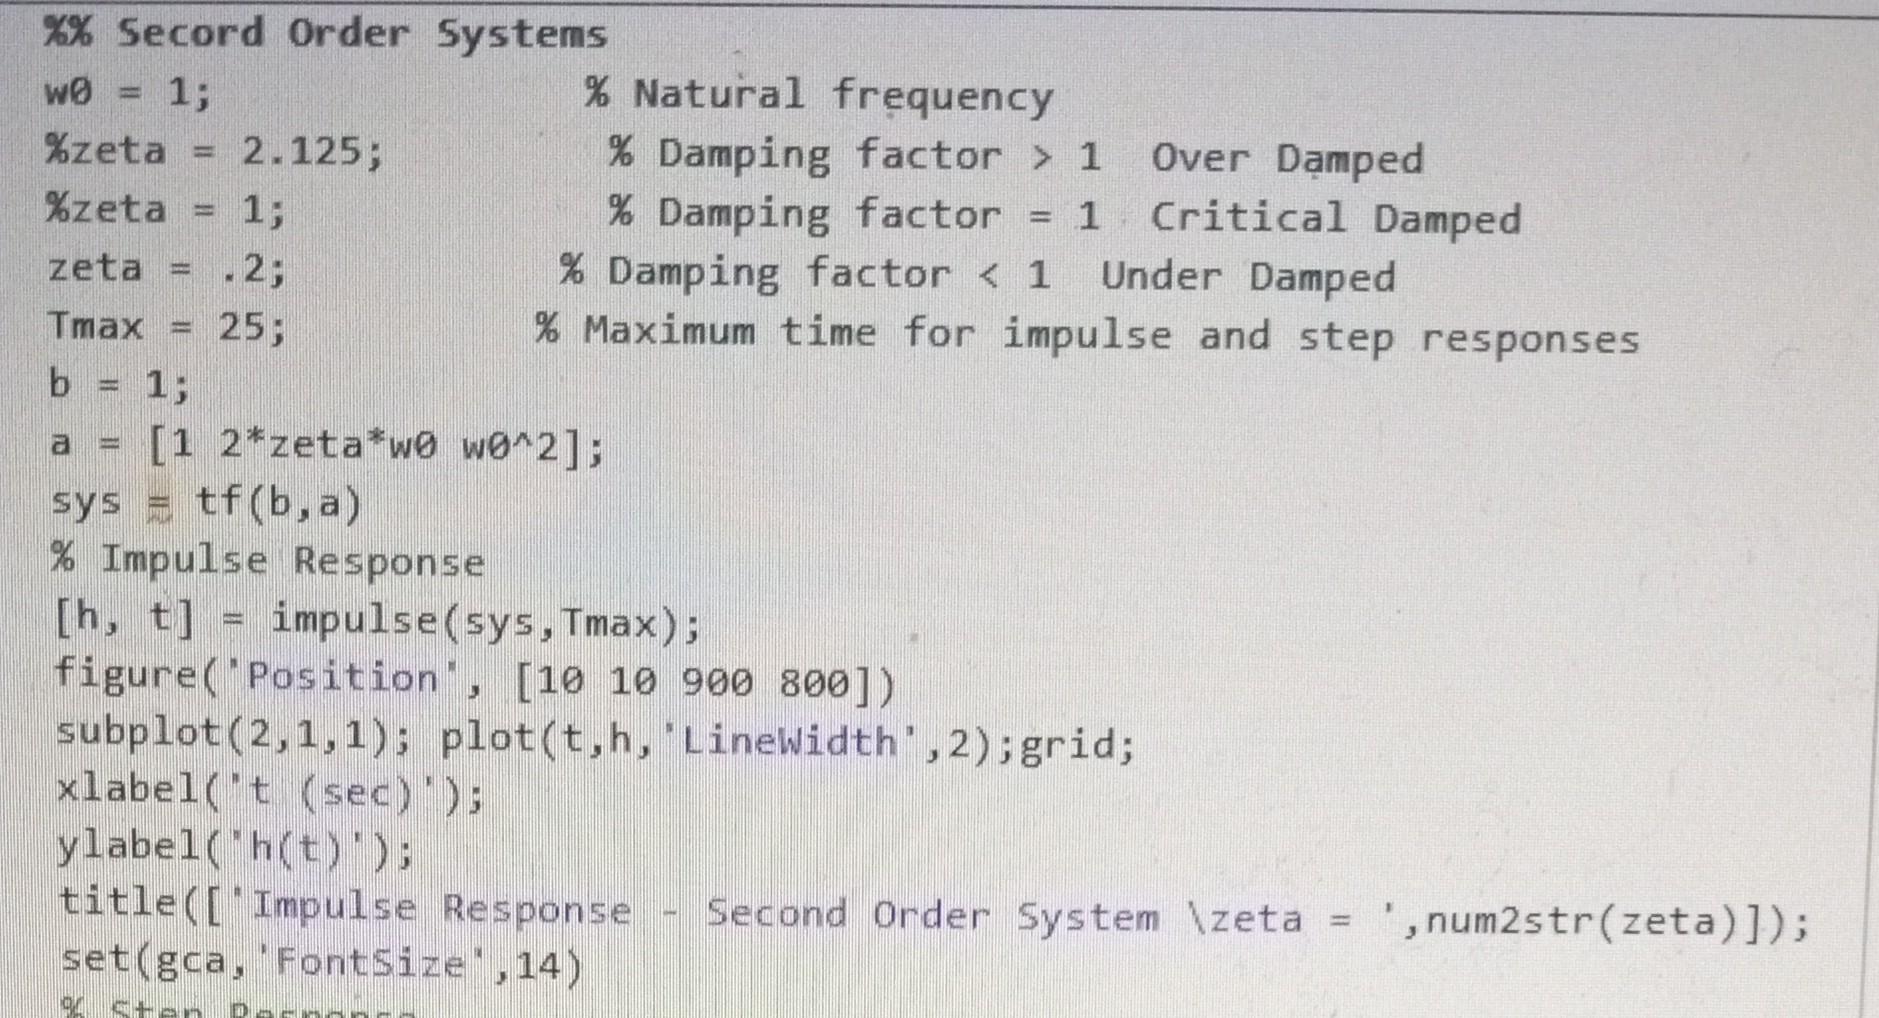
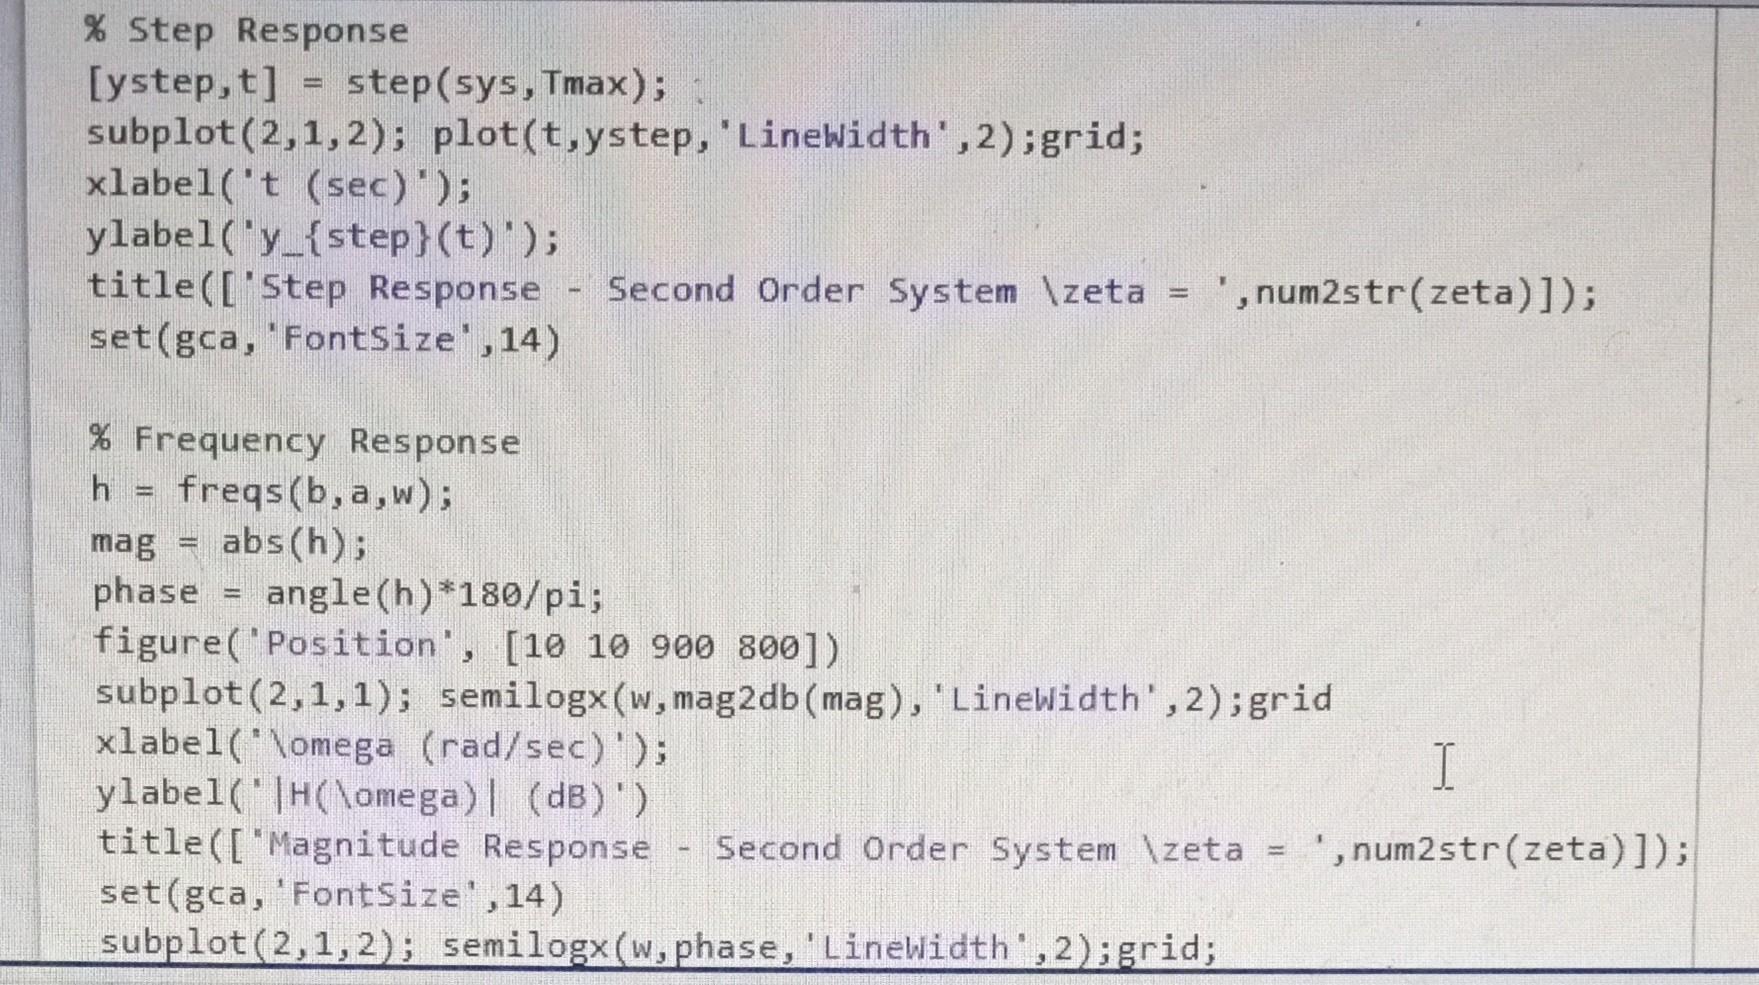
Complete the MATLAB script to obtain the step, impulse, and frequency response for a first order system and a second order system with three separate damping factors: under damped, critically damped, and over damped. Consider displaying the responses of the second order system on over layed graphs, for example the impulse response for all three damping conditions are display as three curves on the same graph. Do the same for the step and frequency responses. Be sure to include a legend to distinguish the curves for each damping condition. Submit your report as a MATLAB published pdf file that includes the code and figures. Everyone must submit your own report; however, you may work with your fellow students. Include your name in the MATLAB script file to indicate you did your own work and did not just copy someone elses. clear; close aI1; clc; \% Define parameters w=logs pace (2,2); \% First Order System a=[11]; b=1 sys =tf(b,a); display( 'Transfer Function, H(s(s)); display(sys); \% Impulse Response [h,t]= impulse(sys); figure('Position , [ [1010900800]) subplot (2,1,1); plot(t,h, 'Linewidth', 2);grid; xlabel('t (sec)); ylabel('h(t)'); title('Impulse Response - First Order System'); set(gca,'Fontsize',14) \% Step Response [ystep,t] = step(sys); subplot (2,1,2); plot(t,ystep, 'Linewidth', 2);grid; xlabel('t (sec)'); ylabel('y_\{step\}(t)'); title('Step Response First Order 5ystem'); set(gca,'Fontsize';14) \% Frequency Response h freqs(b,a,w); mag = abs(h); phase = angle(h)*180/pi; figure( 'Position', [10 10 900 800]) \%\% Secord Order Systems \% Step Response xlabel ("lomega (rad/sec) '); ylabel( "Theta (degrees)') title (["Phase Response - Second Order System \ zeta =, ,num2str(zeta)]); set(gca, 'FontSize' , 14)
Step by Step Solution
There are 3 Steps involved in it

Get step-by-step solutions from verified subject matter experts