

Question: MATLAB Create a GUI called PlotTool with two buttons and one plot. When the sin button is pressed plot a sin wave and when the
MATLAB
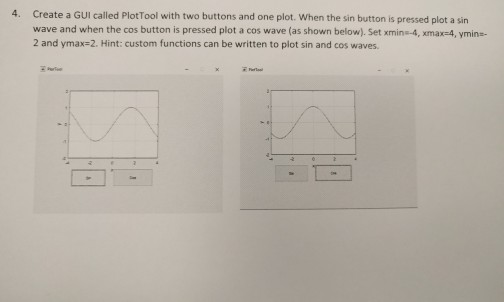
Create a GUI called PlotTool with two buttons and one plot. When the sin button is pressed plot a sin wave and when the cos button is pressed plot a cos wave (as shown below). Set xmin=-4, xmax=4, ymin=-2 and ymax=2
Step by Step Solution
There are 3 Steps involved in it
1 Expert Approved Answer
Step: 1 Unlock

Question Has Been Solved by an Expert!
Get step-by-step solutions from verified subject matter experts
Step: 2 Unlock
Step: 3 Unlock