

Question: #!/usr/bin/env python3 from PyQt5.QtWidgets import QApplication, QMainWindow, QWidget, QVBoxLayout, QHBoxLayout, QPushButton from PyQt5.QtCore import Qt from matplotlib.backends.backend_qt5agg import FigureCanvasQTAgg as FigureCanvas from matplotlib.figure import Figure
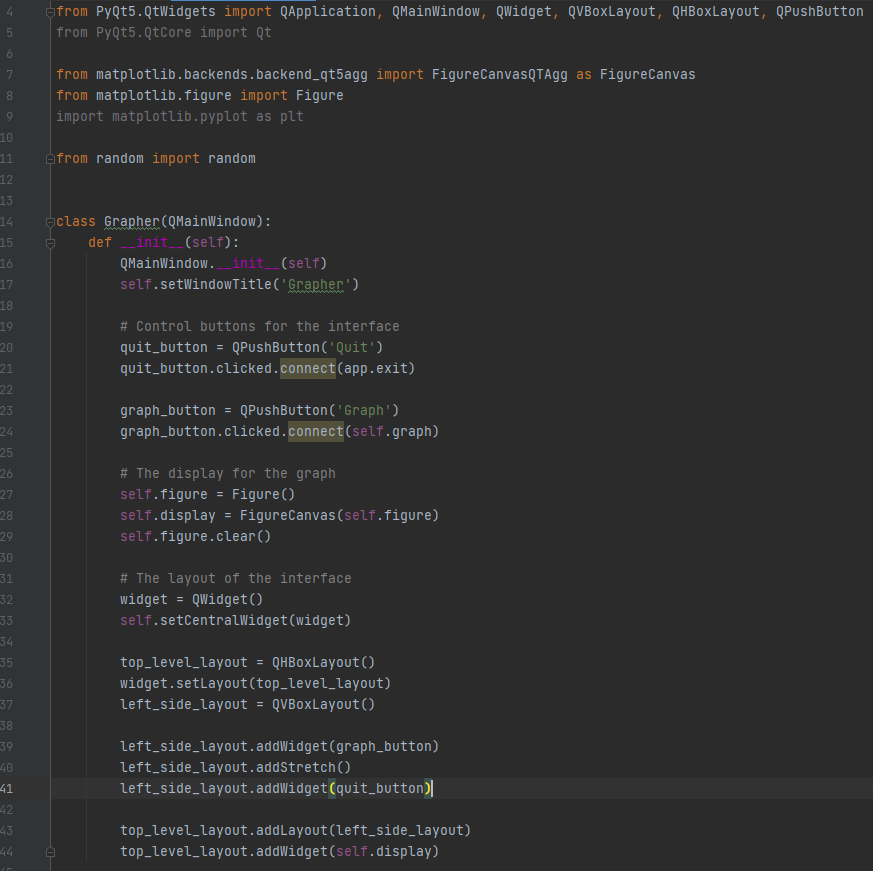
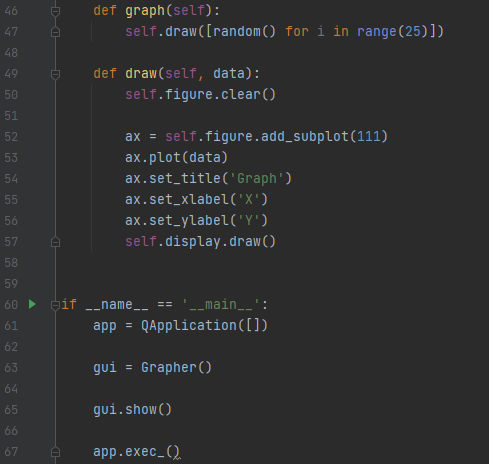
#!/usr/bin/env python3 from PyQt5.QtWidgets import QApplication, QMainWindow, QWidget, QVBoxLayout, QHBoxLayout, QPushButton from PyQt5.QtCore import Qt from matplotlib.backends.backend_qt5agg import FigureCanvasQTAgg as FigureCanvas from matplotlib.figure import Figure import matplotlib.pyplot as plt from random import random class Grapher(QMainWindow): def __init__(self): QMainWindow.__init__(self) self.setWindowTitle('Grapher') # Control buttons for the interface quit_button = QPushButton('Quit') quit_button.clicked.connect(app.exit) graph_button = QPushButton('Graph') graph_button.clicked.connect(self.graph) # The display for the graph self.figure = Figure() self.display = FigureCanvas(self.figure) self.figure.clear() # The layout of the interface widget = QWidget() self.setCentralWidget(widget) top_level_layout = QHBoxLayout() widget.setLayout(top_level_layout) left_side_layout = QVBoxLayout() left_side_layout.addWidget(graph_button) left_side_layout.addStretch() left_side_layout.addWidget(quit_button) top_level_layout.addLayout(left_side_layout) top_level_layout.addWidget(self.display) def graph(self): self.draw([random() for i in range(25)]) def draw(self, data): self.figure.clear() ax = self.figure.add_subplot(111) ax.plot(data) ax.set_title('Graph') ax.set_xlabel('X') ax.set_ylabel('Y') self.display.draw() if __name__ == '__main__': app = QApplication([]) gui = Grapher() gui.show() app.exec_()____________________________________
And the screen shot
I upvote for all correct answers, please hlep out and use python 3 thank you
pyqt5 information could be found online
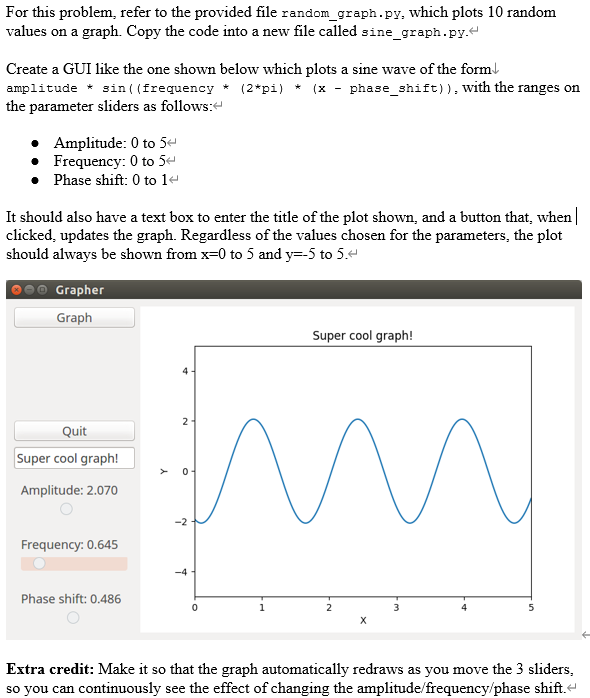
For this problem, refer to the provided file random_graph.py, which plots 10 random values on a graph. Copy the code into a new file called sine_graph.py. Create a GUI like the one shown below which plots a sine wave of the form amplitude * sin((frequency * (2*pi) * (x - phase_shift)), with the ranges on the parameter sliders as follows: Amplitude: 0 to 54 Frequency: 0 to 54 Phase shift: 0 to 14 It should also have a text box to enter the title of the plot shown, and a button that, when | clicked, updates the graph. Regardless of the values chosen for the parameters, the plot should always be shown from x=0 to 5 and y=-5 to 5. Grapher Graph Super cool graph! 4 2 Quit Super cool graph! Y 0 Amplitude: 2.070 -2 Frequency: 0.645 Phase shift: 0.486 o 0 2 3 5 Extra credit: Make it so that the graph automatically redraws as you move the 3 sliders, so you can continuously see the effect of changing the amplitude frequency/phase shift. 4 afrom PyQt5.QtWidgets import QApplication, QMainWindow, QWidget, QVBoxLayout, QHBoxLayout, QPushButton from PyQt5.QtCore import Qt 5 6 7 8 from matplotlib.backends.backend_qt5agg import FigureCanvasQtAgg as FigureCanvas from matplotlib.figure import Figure import matplotlib.pyplot as plt 9 10 from random import random 12 13 15 Eclass Grapher (QMainWindow): def init__(self): QMainWindow.__init__(self) self.setWindowTitle('Grapher.') 16 17 18 19 20 # Control buttons for the interface quit_button = QPushButton('Quit') quit_button.clicked.connect(app.exit) 21 22 23 graph_button = QPushButton('Graph') graph_button.clicked.connect(self.graph) 24 25 26 27 # The display for the graph self.figure Figure() self.display FigureCanvas(self.figure) self.figure.clear() 28 29 30 31 32 # The layout of the interface widget = QWidget() self.setCentralWidget(widget) 33 34 35 36 top_level_layout = QHBoxLayout() widget.setLayout(top_level_layout) left_side_layout = QVBoxLayout() 37 38 39 40 left_side_layout.addWidget(graph_button) left_side_layout.addStretch() left_side_layout.addWidget(quit_button)|| 41 42 43 top_level_layout.addLayout(left_side_layout) top_level_layout.addWidget(self.display) - 46 def graph(self): self.draw([random() for i in range(25)]) 47 A 48 49 def draw(self, data): self.figure.clear() 50 51 52 53 54 ax = self.figure.add_subplot(111) ax.plot(data) ax.set_title('Graph') ax.set_xlabel('X') ax.set_ylabel('Y') self.display.draw() 55 56 57 e 58 59 60 Gif __name__ == '__main__': QApplication([]) 61 app = 62 63 gui Grapher() 64 65 gui.show() 66 67 app.exec_Q. For this problem, refer to the provided file random_graph.py, which plots 10 random values on a graph. Copy the code into a new file called sine_graph.py. Create a GUI like the one shown below which plots a sine wave of the form amplitude * sin((frequency * (2*pi) * (x - phase_shift)), with the ranges on the parameter sliders as follows: Amplitude: 0 to 54 Frequency: 0 to 54 Phase shift: 0 to 14 It should also have a text box to enter the title of the plot shown, and a button that, when | clicked, updates the graph. Regardless of the values chosen for the parameters, the plot should always be shown from x=0 to 5 and y=-5 to 5. Grapher Graph Super cool graph! 4 2 Quit Super cool graph! Y 0 Amplitude: 2.070 -2 Frequency: 0.645 Phase shift: 0.486 o 0 2 3 5 Extra credit: Make it so that the graph automatically redraws as you move the 3 sliders, so you can continuously see the effect of changing the amplitude frequency/phase shift. 4 afrom PyQt5.QtWidgets import QApplication, QMainWindow, QWidget, QVBoxLayout, QHBoxLayout, QPushButton from PyQt5.QtCore import Qt 5 6 7 8 from matplotlib.backends.backend_qt5agg import FigureCanvasQtAgg as FigureCanvas from matplotlib.figure import Figure import matplotlib.pyplot as plt 9 10 from random import random 12 13 15 Eclass Grapher (QMainWindow): def init__(self): QMainWindow.__init__(self) self.setWindowTitle('Grapher.') 16 17 18 19 20 # Control buttons for the interface quit_button = QPushButton('Quit') quit_button.clicked.connect(app.exit) 21 22 23 graph_button = QPushButton('Graph') graph_button.clicked.connect(self.graph) 24 25 26 27 # The display for the graph self.figure Figure() self.display FigureCanvas(self.figure) self.figure.clear() 28 29 30 31 32 # The layout of the interface widget = QWidget() self.setCentralWidget(widget) 33 34 35 36 top_level_layout = QHBoxLayout() widget.setLayout(top_level_layout) left_side_layout = QVBoxLayout() 37 38 39 40 left_side_layout.addWidget(graph_button) left_side_layout.addStretch() left_side_layout.addWidget(quit_button)|| 41 42 43 top_level_layout.addLayout(left_side_layout) top_level_layout.addWidget(self.display) - 46 def graph(self): self.draw([random() for i in range(25)]) 47 A 48 49 def draw(self, data): self.figure.clear() 50 51 52 53 54 ax = self.figure.add_subplot(111) ax.plot(data) ax.set_title('Graph') ax.set_xlabel('X') ax.set_ylabel('Y') self.display.draw() 55 56 57 e 58 59 60 Gif __name__ == '__main__': QApplication([]) 61 app = 62 63 gui Grapher() 64 65 gui.show() 66 67 app.exec_
Step by Step Solution
There are 3 Steps involved in it

Get step-by-step solutions from verified subject matter experts