

Question: MATLAB IMAGE ANALYSIS HELP- Thank you! *****If you do not trust the link and need the image file, search Distribution of interneurons expressing EGFP and
MATLAB IMAGE ANALYSIS HELP- Thank you!
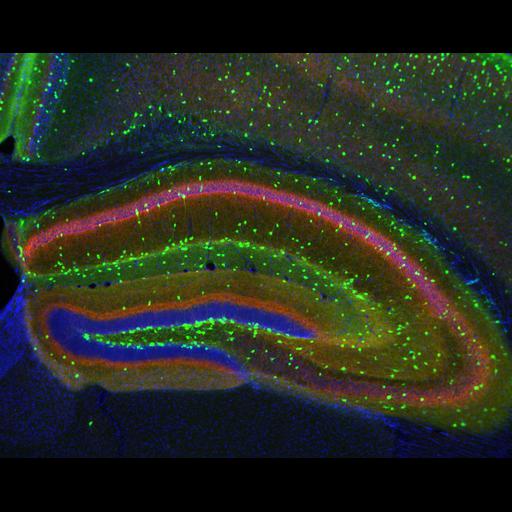
*****If you do not trust the link and need the image file, search "Distribution of interneurons expressing EGFP" and the picture should be in google images.******
1. Using the image attached - it's from here (http://www.cellimagelibrary.org/images/14971).
Do the following:
1a. Plot each channel separately using subplot to put them all on the same figure. To visualize the channels you will likely need to adjust the contrast to make it visible. Submit this subplot
1b. Plot a full color rgb image of the image. You may need to use imadjust to adjust he contrast to make the image visible. Submit this image.
1c. Plot a histogram of channel 3 of the image. Note that there are two peaks. Determine a reasonable threshold between the two peaks. Explain in comments in code your choice of threshold.
1d. Using this threshold, generate and plot a boolean "mask" image from channel 3 to keep only the pixels from the higher (more intense) peak.
1e. Mask all three channels with this boolean image, then plot the new 3-color "masked" image.
Step by Step Solution
There are 3 Steps involved in it

Get step-by-step solutions from verified subject matter experts