

Question: Matlab Image Processing help! I need to create a USER-CREATED gaussian filter using matlab. Please see the attachment for full instructions of what I am
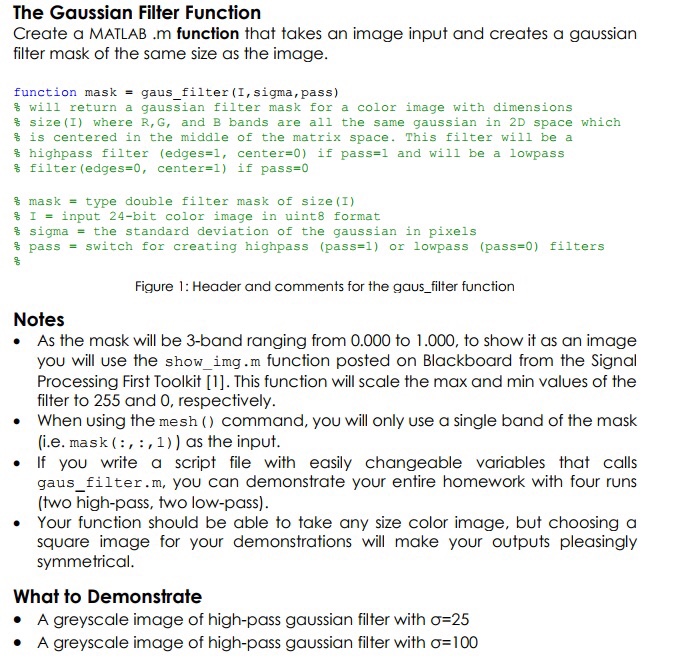
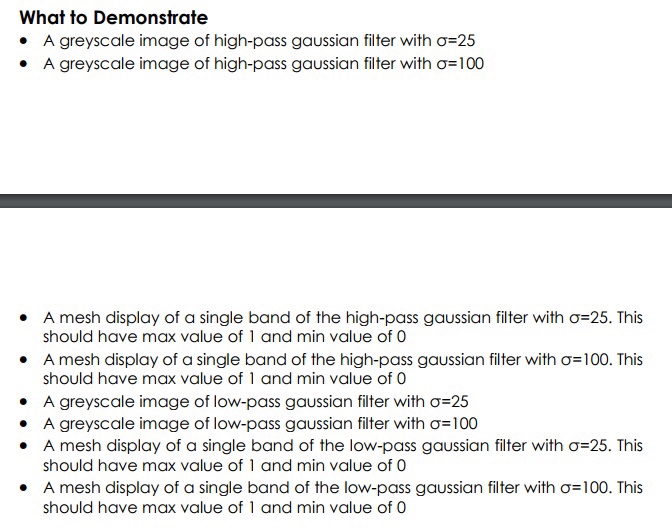
The Gaussian Filter Function Create a MATLAB .m function that takes an image input and creates a gaussian filter mask of the same size as the image function mask gaus filter (1, sigma , pass) = will return a gaussian filter mask for a color image with dimensions % size (1) where R, G, and B bands are all the same gaussian in 2D space which % is centered in the middle of the matrix space. This filter will be a (edges-1, center=1) center=0) if pass- if pass-1 and will be lowpass highpass filter % a filter (edges-0, % mask-type double filter mask of size (1) % 1 = input 24-bit color image in uint8 format % sigma = the standard deviation of the gaussian in pixels % pass = switch for creating highpass (pass ) or lowpass (pass#0) filters Figure 1: Header and comments for the gaus filter function Notes . As the mask will be 3-band ranging from 0.000 to 1.000, to show it as an image you will use the show_img.m function posted on Blackboard from the Signal Processing First Toolkit [1]. This function will scale the max and min values of the filter to 255 and 0, respectively . When using the mesh ) Command, you will only use a single band of the mask (i.e. mask (,,1)) as the input . If you write a script file with easily changeable variables that calls gaus_filter.m, you can demonstrate your entire homework with four runs (two high-pass, two low-pass) . Your function should be able to take any size color image, but choosing a square image for your demonstrations will make your outputs pleasingly symmetrical What to Demonstrate A greyscale image of high-pass gaussian filter with =25 A greyscale image of high-pass gaussian filter with =100 The Gaussian Filter Function Create a MATLAB .m function that takes an image input and creates a gaussian filter mask of the same size as the image function mask gaus filter (1, sigma , pass) = will return a gaussian filter mask for a color image with dimensions % size (1) where R, G, and B bands are all the same gaussian in 2D space which % is centered in the middle of the matrix space. This filter will be a (edges-1, center=1) center=0) if pass- if pass-1 and will be lowpass highpass filter % a filter (edges-0, % mask-type double filter mask of size (1) % 1 = input 24-bit color image in uint8 format % sigma = the standard deviation of the gaussian in pixels % pass = switch for creating highpass (pass ) or lowpass (pass#0) filters Figure 1: Header and comments for the gaus filter function Notes . As the mask will be 3-band ranging from 0.000 to 1.000, to show it as an image you will use the show_img.m function posted on Blackboard from the Signal Processing First Toolkit [1]. This function will scale the max and min values of the filter to 255 and 0, respectively . When using the mesh ) Command, you will only use a single band of the mask (i.e. mask (,,1)) as the input . If you write a script file with easily changeable variables that calls gaus_filter.m, you can demonstrate your entire homework with four runs (two high-pass, two low-pass) . Your function should be able to take any size color image, but choosing a square image for your demonstrations will make your outputs pleasingly symmetrical What to Demonstrate A greyscale image of high-pass gaussian filter with =25 A greyscale image of high-pass gaussian filter with =100
Step by Step Solution
There are 3 Steps involved in it

Get step-by-step solutions from verified subject matter experts