

Question: MATLAB ONLY !! (a) Modify an M-file for Taylor Series from Lab1A (e.g. for exp(x) without using Horner) to compute and plot the Taylor series
MATLAB ONLY !!
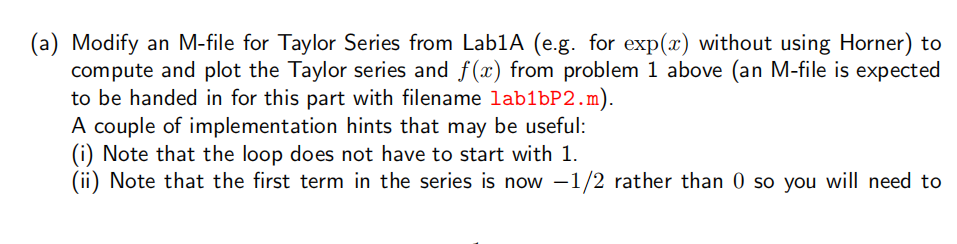
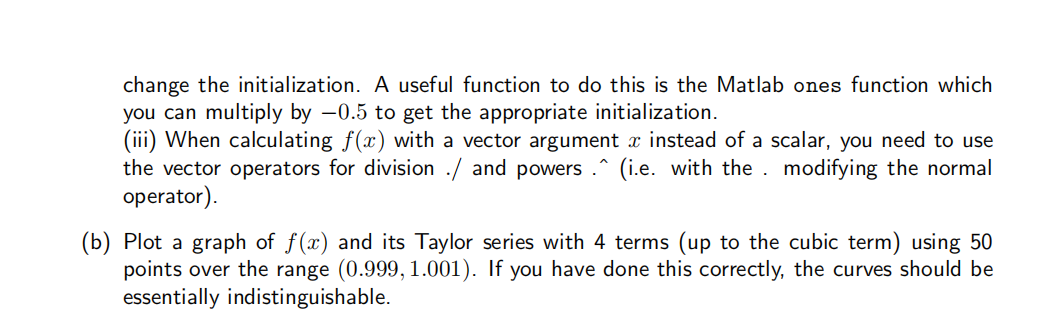
(a) Modify an M-file for Taylor Series from Lab1A (e.g. for exp(x) without using Horner) to compute and plot the Taylor series and f(x) from problem 1 above (an M-file is expected to be handed in for this part with filename lab1bP2.m). A couple of implementation hints that may be useful: (i) Note that the loop does not have to start with 1. (ii) Note that the first term in the series is now 1/2 rather than 0 so you will need to change the initialization. A useful function to do this is the Matlab ones function which you can multiply by -0.5 to get the appropriate initialization. (iii) When calculating f(x) with a vector argument x instead of a scalar, you need to use the vector operators for division. / and powers .^ (i.e. with the modifying the normal operator). (b) Plot a graph of f(x) and its Taylor series with 4 terms (up to the cubic term) using 50 points over the range (0.999, 1.001). If you have done this correctly, the curves should be essentially indistinguishable. (a) Modify an M-file for Taylor Series from Lab1A (e.g. for exp(x) without using Horner) to compute and plot the Taylor series and f(x) from problem 1 above (an M-file is expected to be handed in for this part with filename lab1bP2.m). A couple of implementation hints that may be useful: (i) Note that the loop does not have to start with 1. (ii) Note that the first term in the series is now 1/2 rather than 0 so you will need to change the initialization. A useful function to do this is the Matlab ones function which you can multiply by -0.5 to get the appropriate initialization. (iii) When calculating f(x) with a vector argument x instead of a scalar, you need to use the vector operators for division. / and powers .^ (i.e. with the modifying the normal operator). (b) Plot a graph of f(x) and its Taylor series with 4 terms (up to the cubic term) using 50 points over the range (0.999, 1.001). If you have done this correctly, the curves should be essentially indistinguishable
Step by Step Solution
There are 3 Steps involved in it

Get step-by-step solutions from verified subject matter experts