

Question: MATLAB ONLY Please 2. A tensile testing machine is shown in the following figure to determine the behavior of materials as they are deformed. (a)
MATLAB ONLY Please
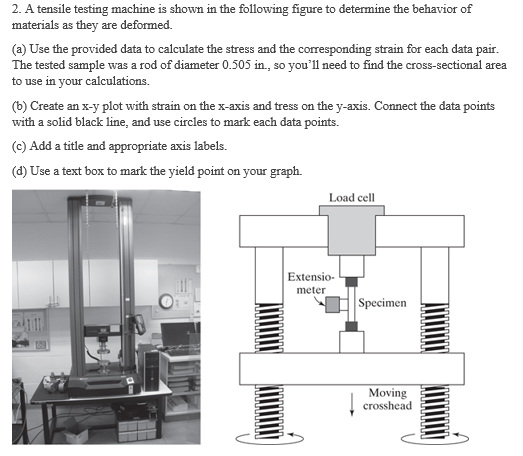
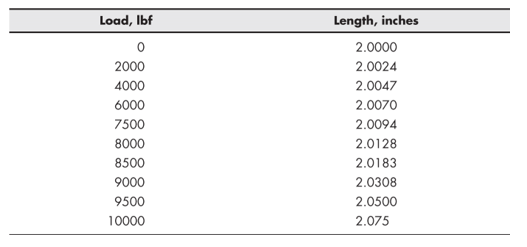
2. A tensile testing machine is shown in the following figure to determine the behavior of materials as they are deformed. (a) Use the provided data to calculate the stress and the corresponding strain for each data pair. The tested sample was a rod of diameter 0.505 in., so you'll need to find the cross-sectional area to use in your calculations. (b) Create an x-y plot with strain on the x-axis and tress on the y-axis. Connect the data points with a solid black line, and use circles to mark each data points. (c) Add a title and appropriate axis labels. (d) Use a text box to mark the yield point on your graph. Load cell Extensio- meter Specimen Moving crosshead
Step by Step Solution
There are 3 Steps involved in it

Get step-by-step solutions from verified subject matter experts