

Question: MATLAB Plots: Use one figure with two subplots. Title each plot with its problem number and part. Label the axes. Add a legend. If the
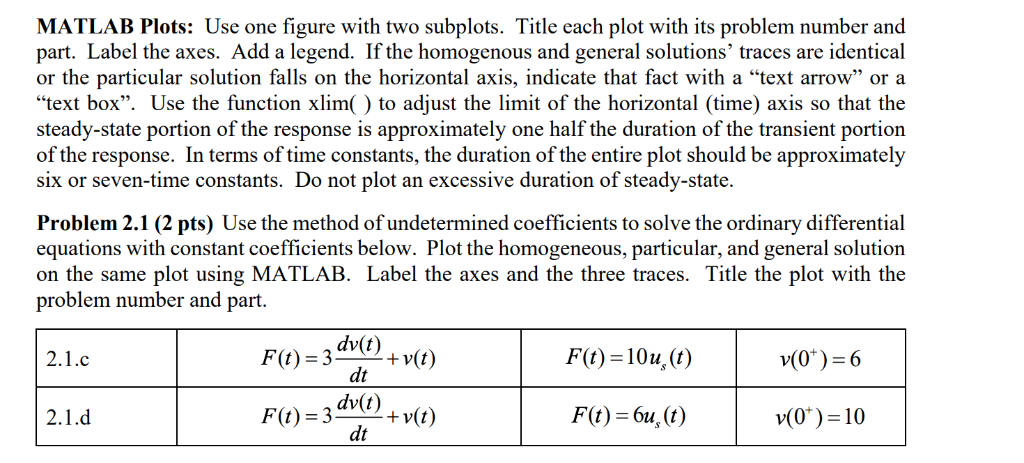
MATLAB Plots: Use one figure with two subplots. Title each plot with its problem number and part. Label the axes. Add a legend. If the homogenous and general solutions' traces are identical or the particular solution falls on the horizontal axis, indicate that fact with a "text arrow" or a "text box". Use the function xlim() to adjust the limit of the horizontal (time) axis so that the steady-state portion of the response is approximately one half the duration of the transient portion of the response. In terms of time constants, the duration of the entire plot should be approximately six or seven-time constants. Do not plot an excessive duration of steady-state. Problem 2.1 (2 pts) Use the method of undetermined coefficients to solve the ordinary differential equations with constant coefficients below. Plot the homogeneous, particular, and general solution on the same plot using MATLAB. Label the axes and the three traces. Title the plot with the problem number and part. dv(t) dt dv(t) dt v(0) 10 MATLAB Plots: Use one figure with two subplots. Title each plot with its problem number and part. Label the axes. Add a legend. If the homogenous and general solutions' traces are identical or the particular solution falls on the horizontal axis, indicate that fact with a "text arrow" or a "text box". Use the function xlim() to adjust the limit of the horizontal (time) axis so that the steady-state portion of the response is approximately one half the duration of the transient portion of the response. In terms of time constants, the duration of the entire plot should be approximately six or seven-time constants. Do not plot an excessive duration of steady-state. Problem 2.1 (2 pts) Use the method of undetermined coefficients to solve the ordinary differential equations with constant coefficients below. Plot the homogeneous, particular, and general solution on the same plot using MATLAB. Label the axes and the three traces. Title the plot with the problem number and part. dv(t) dt dv(t) dt v(0) 10
Step by Step Solution
There are 3 Steps involved in it

Get step-by-step solutions from verified subject matter experts