

Question: MATLAB PLOTTING I cant figure out how to plot the two lines on the bottom of the graph in the picture. They are supposed to
MATLAB PLOTTING
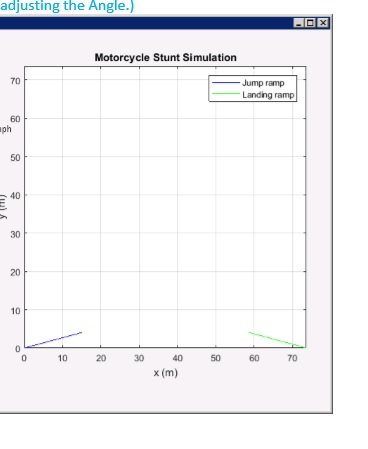
I cant figure out how to plot the two lines on the bottom of the graph in the picture. They are supposed to ramps that are 15 meter that will adjust the angle based on an inputed angle from the user. I was thinking something along the lines of
%get user input
angle = input('degrees: ')
%ramp length
length = 15
x = length*cosd(alpha)
plot(x...........
but not sure what to do from here or if its in the right direction to write the code
adjusting the Angle.) Motorcycle Stunt Simulation 70 -Jump ramp Landing ramp 60 ph 50 40 30 20 10 10 20 30 40 50 60 70 x (m)
Step by Step Solution
There are 3 Steps involved in it
1 Expert Approved Answer
Step: 1 Unlock

Question Has Been Solved by an Expert!
Get step-by-step solutions from verified subject matter experts
Step: 2 Unlock
Step: 3 Unlock