

Question: Matlab question: (Show code/plots if possible) It is difficult to identify the frequency components by looking at the original signal in the time domain. We
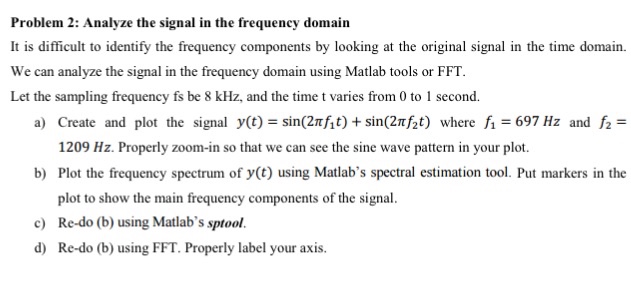
It is difficult to identify the frequency components by looking at the original signal in the time domain. We can analyze the signal in the frequency domain using Matlab tools or FFT Let the sampling frequency be 8 kHz, and the time t varies from 0 to 1 second. Create and plot the signal y(t) 3sin(2 pi f_1 t) sin(2 pi f_2 t) where f_1 = 697 Hz and f_2 = 1209 Hz. Properly zoom-in so that we can see the sine wave pattern in your plot Plot the frequency spectrum of y(t) using Matlab's spectral estimation tool. Put markers in the plot to show the main frequency components of the signal. Re-do (b) using Matlab's sptool Re-do (b) using FFT. Properly label your axis
Step by Step Solution
There are 3 Steps involved in it

Get step-by-step solutions from verified subject matter experts