

Question: MATLAB The data in Quiz2Data is a file with x values named 'x' and y values named 'y' 3. Do the following parts using the
 MATLAB
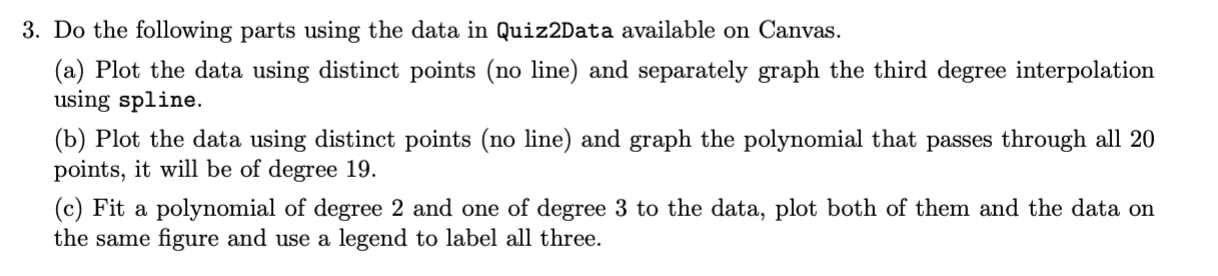
The data in Quiz2Data is a file with x values named 'x' and y values named 'y'
3. Do the following parts using the data in Quiz2Data available on Canvas. (a) Plot the data using distinct points (no line) and separately graph the third degree interpolation using spline. (b) Plot the data using distinct points (no line) and graph the polynomial that passes through all 20 points, it will be of degree 19. (c) Fit a polynomial of degree 2 and one of degree 3 to the data, plot both of them and the data on the same figure and use a legend to label all three. 3. Do the following parts using the data in Quiz2Data available on Canvas. (a) Plot the data using distinct points (no line) and separately graph the third degree interpolation using spline. (b) Plot the data using distinct points (no line) and graph the polynomial that passes through all 20 points, it will be of degree 19. (c) Fit a polynomial of degree 2 and one of degree 3 to the data, plot both of them and the data on the same figure and use a legend to label all three
Step by Step Solution
There are 3 Steps involved in it

Get step-by-step solutions from verified subject matter experts