

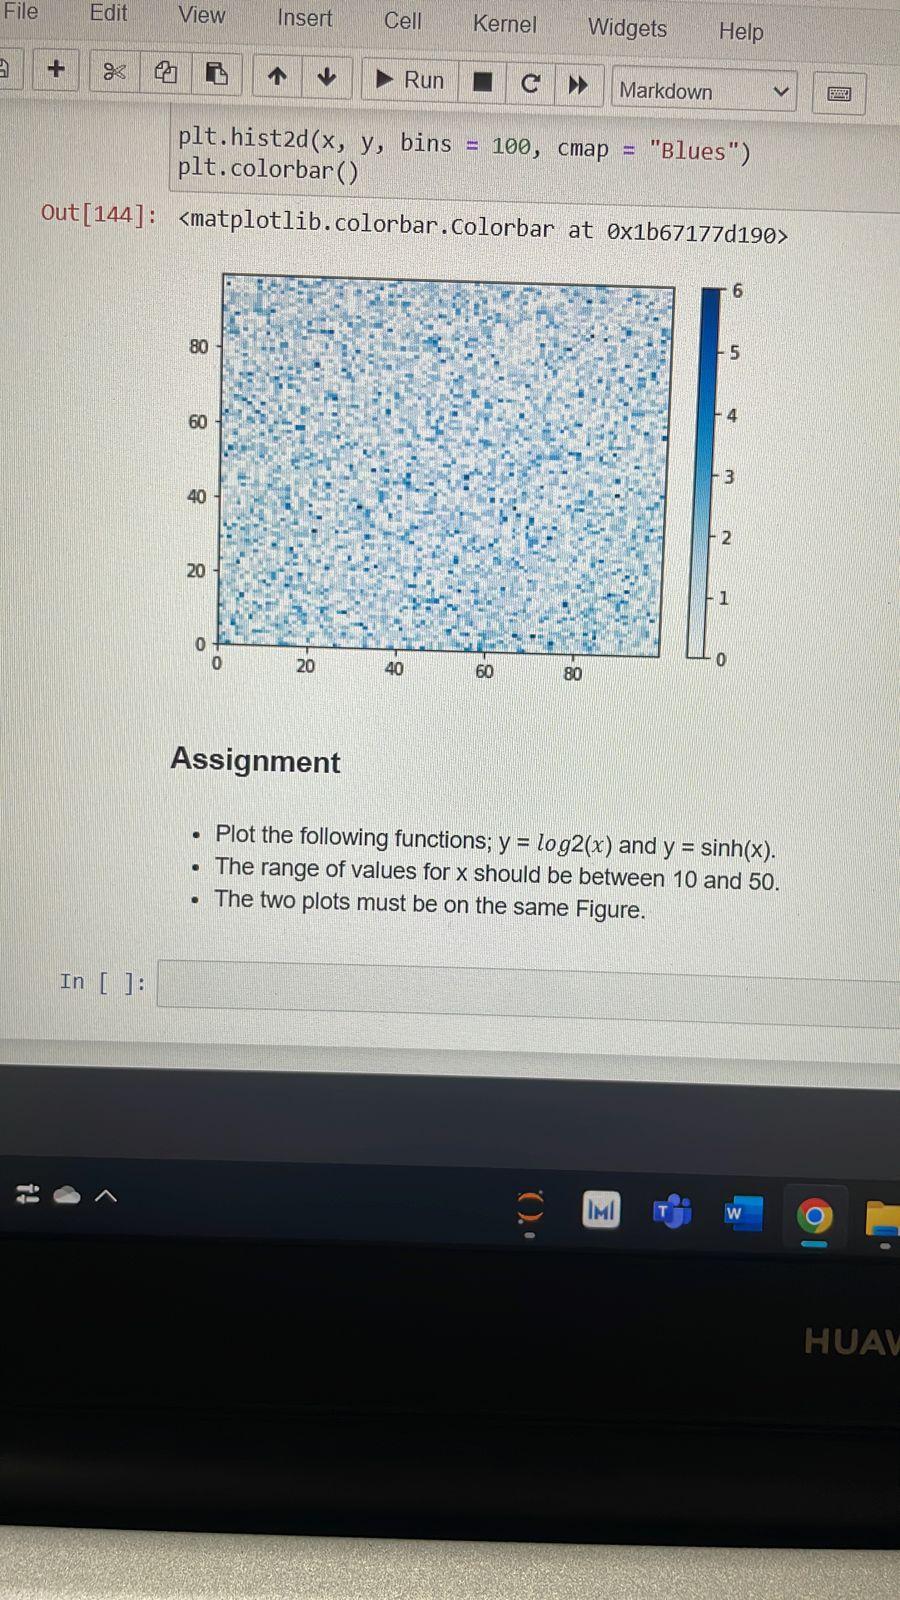
Question: matplotlib.colorbar. Colorbar at 01667177d190 Assignment - Plot the following functions; y=log2(x) and y=sinh(x). - The range of values for x should be between 10 and
Step by Step Solution
There are 3 Steps involved in it
1 Expert Approved Answer
Step: 1 Unlock

Question Has Been Solved by an Expert!
Get step-by-step solutions from verified subject matter experts
Step: 2 Unlock
Step: 3 Unlock