

Question: Mean chart and Range chart. Data file can be found under week 3 materials. For mean chart and range chart, please see data set under
-
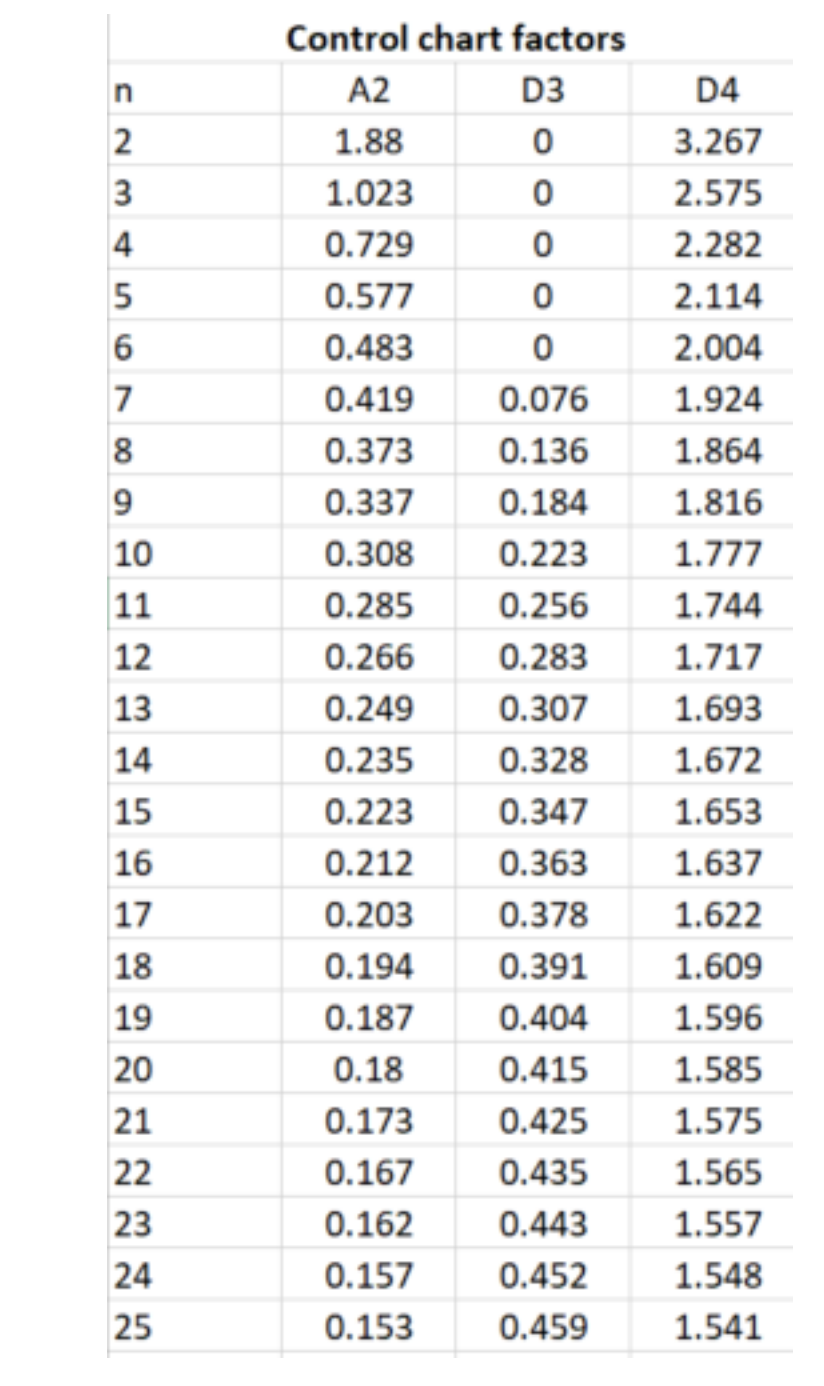
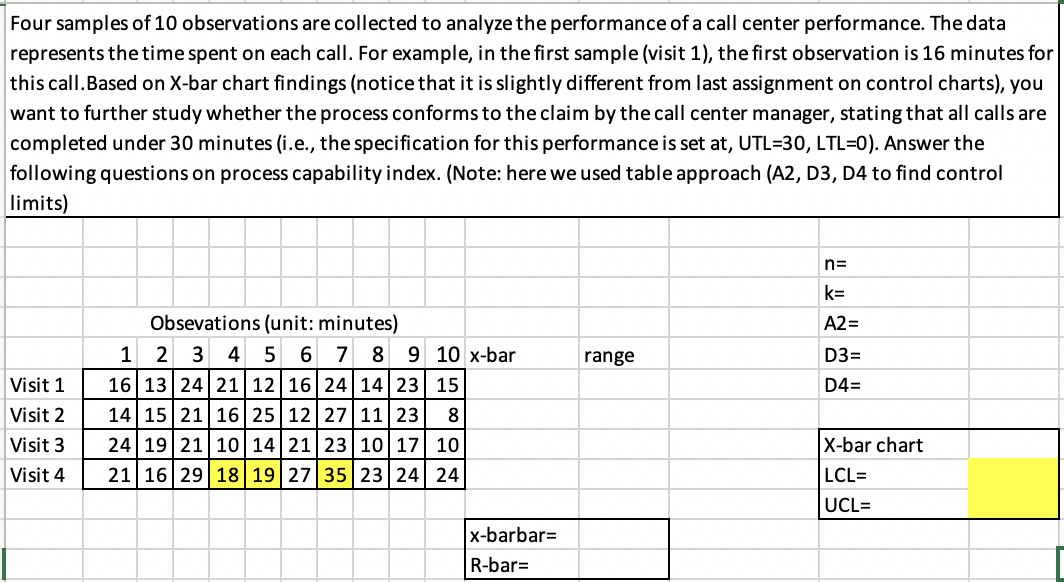
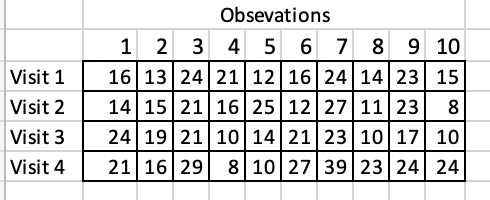 Mean chart and Range chart. Data file can be found under week 3 materials. For mean chart and range chart, please see data set under tab "mean chart and range chart". Question 14 to 19 are based on this data. Four samples of 10 observations are collected to analyze the performance of a call center performance. The data represents the time spent on each call. For example, in the first sample (visit 1), the first observation is 16 minutes for this call. With the control chart table (found under week 3 materials and attached with the data file), what is A2 to be used in mean chart? Round your answer to two decimals. For example, if your answer is 2.234, fill in 2.23.
1 points
QUESTION 15
-
Based on the last question, what is X-bar-bar? Round your answer to one decimal, for example, if your answer is 10.43, round it to be 10.4.
1 points
QUESTION 16
-
Similarly, what is R-bar? Round your answer to one decimal. For example, if your answer is 10.43, round it to 10.4.
1 points
QUESTION 17
-
What is the UCL for mean chart? Round your answer to two decimals.
1 points
QUESTION 18
-
What is the LCL for the R chart? Round your answer to two decimals.
1 points
QUESTION 19
-
Process in control?
Step by Step Solution
There are 3 Steps involved in it

Get step-by-step solutions from verified subject matter experts