

Question: Measured volume fraction (Vf) data for a hypothetical diffusion- controlled a to phase transformation are shown in Table 1 for three different temperatures. (a)
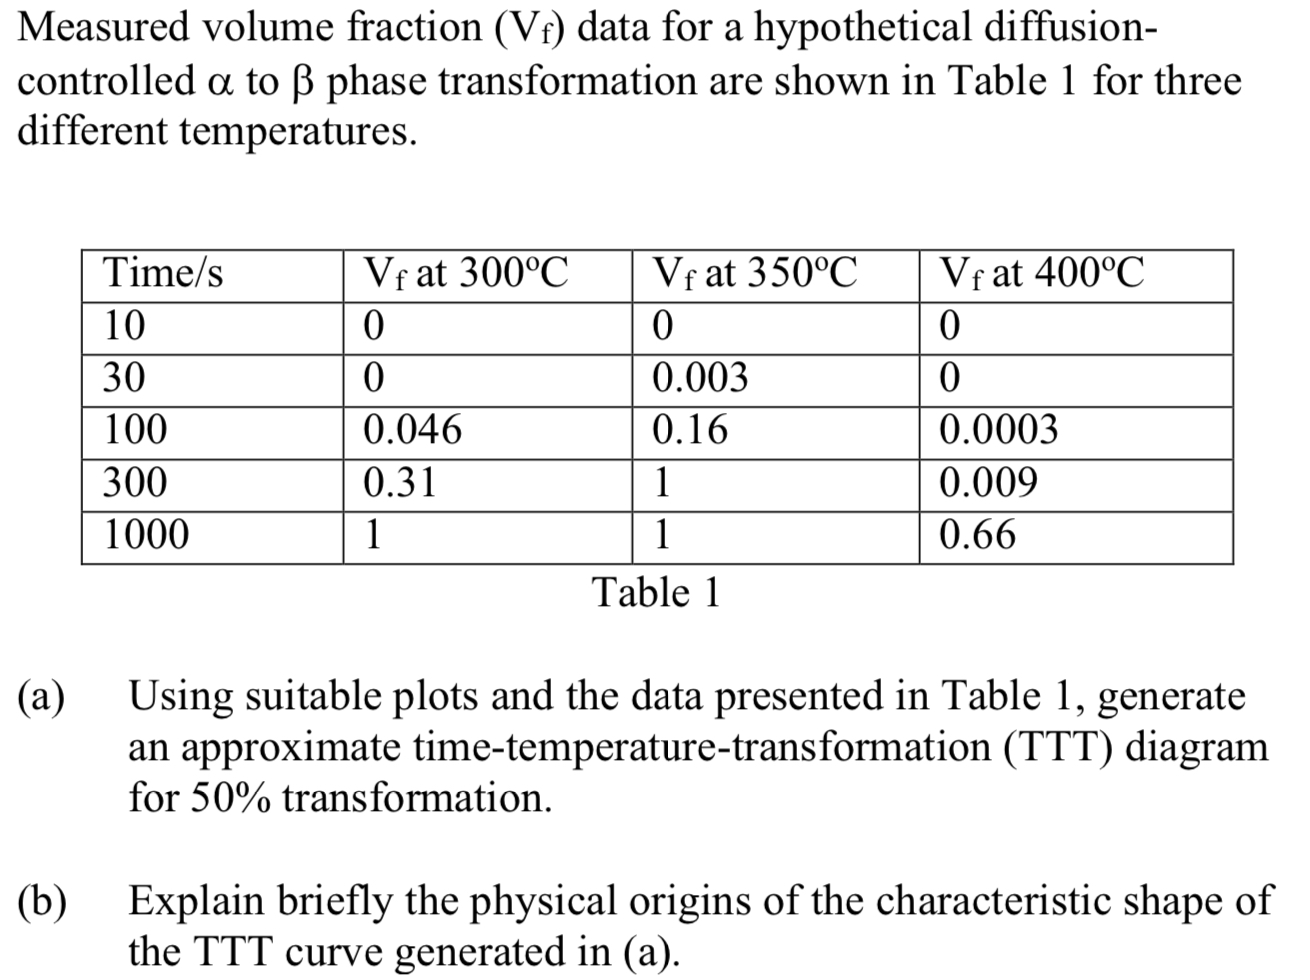
Measured volume fraction (Vf) data for a hypothetical diffusion- controlled a to phase transformation are shown in Table 1 for three different temperatures. (a) (b) Time/s 10 30 100 300 1000 Vf at 300C 0 0 0.046 0.31 1 Vf at 350C 0 0.003 0.16 1 1 Table 1 Vf at 400C 0 0 0.0003 0.009 0.66 Using suitable plots and the data presented in Table 1, generate an approximate time-temperature-transformation (TTT) diagram for 50% transformation. Explain briefly the physical origins of the characteristic shape of the TTT curve generated in (a).
Step by Step Solution
There are 3 Steps involved in it
To generate an approximate timetemperaturetransformation TTT diagram for 50 transformation using the ... View full answer

Get step-by-step solutions from verified subject matter experts