

Question: median, mode, and standard deviation. Data Set Draw a dotplot and describe the shape of the distribution. a) A= (4, 4,5, 6, 6, 6, 7,
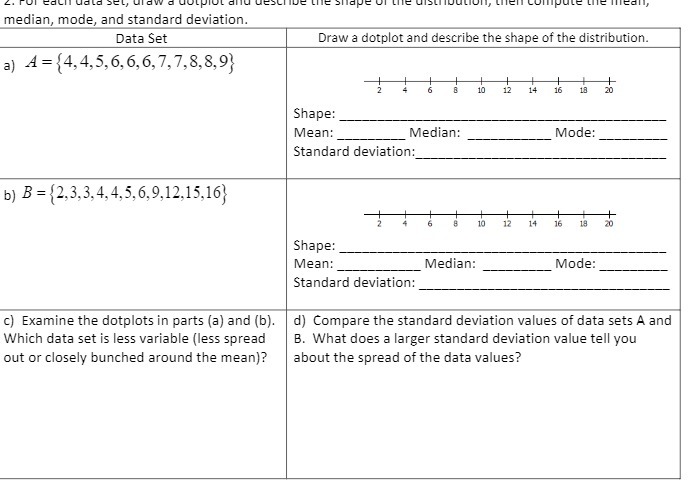
median, mode, and standard deviation. Data Set Draw a dotplot and describe the shape of the distribution. a) A= (4, 4,5, 6, 6, 6, 7, 7,8,8,9 10 12 14 16 18 20 Shape: Mean: Median: Mode: Standard deviation: b) B = 2,3,3, 4, 4,5, 6,9,12,15,16 10 12 14 16 14 Shape: Mean: Median: Mode: Standard deviation: c) Examine the dotplots in parts (a) and (b). d) Compare the standard deviation values of data sets A and Which data set is less variable (less spread B. What does a larger standard deviation value tell you out or closely bunched around the mean)? about the spread of the data values
Step by Step Solution
There are 3 Steps involved in it
1 Expert Approved Answer
Step: 1 Unlock

Question Has Been Solved by an Expert!
Get step-by-step solutions from verified subject matter experts
Step: 2 Unlock
Step: 3 Unlock