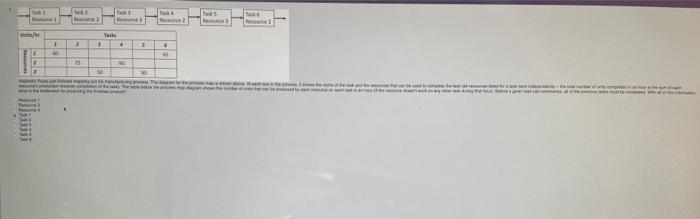
Question: mehr 1 2 1 . 15 96 Task 1 Resource 1 Task 2 Resource 2 Task 3 Resource 3 Task 4 Resource 2 Task 5

mehr 1 2 1 . 15 96 Task 1 Resource 1 Task 2
mehr 1 2 1 . 15 96 Task 1 Resource 1 Task 2 Resource 2 Task 3 Resource 3 Task 4 Resource 2 Task 5 Resource 3 Task 6 Resource 1 Units/hr Tasks 1 2 3 4 5 6 1 60 65 Resources 2 75 90 3 50 90 Alejandro Rojas just finished mapping out his manufacturing process. The diagram for the process map is shown above. At each box in the process, it shows the resource's production towards completion of the task). The table below the process map diagram shows the number of units that can be produced by each resou what is the bottleneck for producing the finished product? Resource 1 Resource 2 Resource 3 o Task 1 Task 2 Task 3 Task 4 Task 5 Task 6 img021.Kwame Botong of the task and the resources that can be used to complete the task (all resources listed for a task work independenty - the total number of units completed in an hour is the sum of each each task in an hour (if the resource doesn't work on any other task during that hour). Before a given task can commence, all of the previous tasks must be completed. With af of this information, 50 90 Alejandro Rojas just finished mapping out his manufacturing process. The diagram for the process map is shown above. A resource's production towards completion of the task). The table below the process map diagram shows the number of unit what is the bottleneck for producing the finished product? Resource 1 Resource 2 Resource 3 o Task 1 Task 2 Task 3 Task 4 Task 5 Task 6 mehr 1 2 1 . 15 96 Task 1 Resource 1 Task 2 Resource 2 Task 3 Resource 3 Task 4 Resource 2 Task 5 Resource 3 Task 6 Resource 1 Units/hr Tasks 1 2 3 4 5 6 1 60 65 Resources 2 75 90 3 50 90 Alejandro Rojas just finished mapping out his manufacturing process. The diagram for the process map is shown above. At each box in the process, it shows the resource's production towards completion of the task). The table below the process map diagram shows the number of units that can be produced by each resou what is the bottleneck for producing the finished product? Resource 1 Resource 2 Resource 3 o Task 1 Task 2 Task 3 Task 4 Task 5 Task 6 img021.Kwame Botong of the task and the resources that can be used to complete the task (all resources listed for a task work independenty - the total number of units completed in an hour is the sum of each each task in an hour (if the resource doesn't work on any other task during that hour). Before a given task can commence, all of the previous tasks must be completed. With af of this information, 50 90 Alejandro Rojas just finished mapping out his manufacturing process. The diagram for the process map is shown above. A resource's production towards completion of the task). The table below the process map diagram shows the number of unit what is the bottleneck for producing the finished product? Resource 1 Resource 2 Resource 3 o Task 1 Task 2 Task 3 Task 4 Task 5 Task 6

Step by Step Solution

There are 3 Steps involved in it

1 Expert Approved Answer
Step: 1 Unlock blur-text-image
Question Has Been Solved by an Expert!

Get step-by-step solutions from verified subject matter experts

Step: 2 Unlock
Step: 3 Unlock

Students Have Also Explored These Related General Management Questions!