

Question: Metrics 3.1 Question Help The U.S. Census Bureau provides considerable demograp o n change in the total and Hispanic populations occurred in each state between
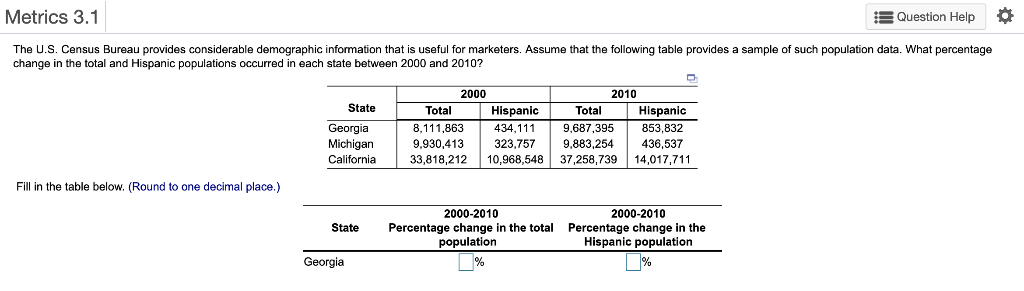
Metrics 3.1 Question Help The U.S. Census Bureau provides considerable demograp o n change in the total and Hispanic populations occurred in each state between 2000 and 2010? arketers. Assume that the following table provides a sample of such population data. What percentage 2010 2000 State Total Hispanic 434 111 Total Hispanic 853 832 Georgia 8,111,863 9.687. 9.930.413 323 757 a a83 254 436.537 10.968,548 California 33,818,212 37,258.739 14,017,711 Fill in the table below. (Round to one decimal place.) 2000-2010 Percentage change in the total population 2000-2010 Percentage change in the Hispanic population State Georgia
Step by Step Solution
There are 3 Steps involved in it

Get step-by-step solutions from verified subject matter experts