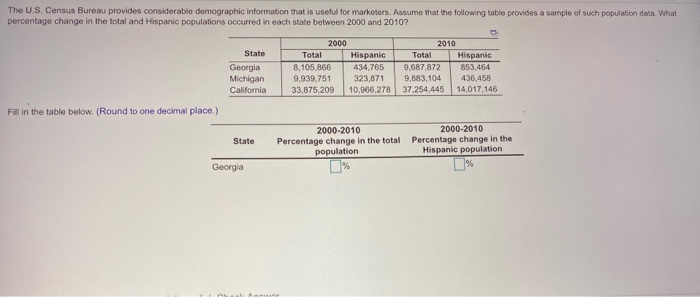
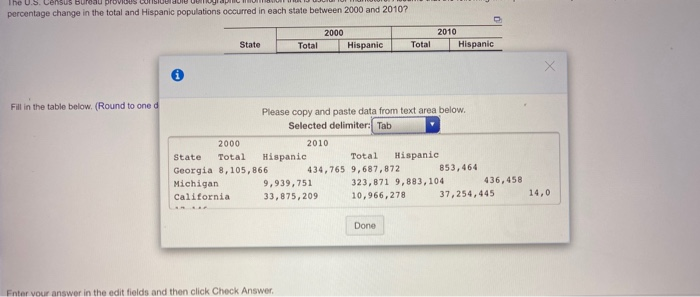
Question: The U.S. Census Bureau provides considerable demographic information that is useful for marketers. Assume that the following table provides a sample of such population data.

The U.S. Census Bureau provides considerable
The U.S. Census Bureau provides considerable demographic information that is useful for marketers. Assume that the following table provides a sample of such population data. What percentage change in the total and Hispanic populations occurred in each state between 2000 and 2010? State Georgia Michigan California 2000 Total Hispanic 8,105.866 434,765 9.939.751 323,871 33,875,209 10,966,278 2010 Total Hispanic 9.687.872 853,484 9,883,104 436,458 37.254,445 14,017,146 Fill in the table below. (Round to one decimal place.) State 2000-2010 Percentage change in the total population 2000-2010 Percentage change in the Hispanic population Georgia The U.S. Census Bureau provides percentage change in the total and Hispanic populations occurred in each state between 2000 and 2010? State 2000 Hispanic 2010 Hispanic Total Total Fill in the table below (Round to one d Please copy and paste data from text area below. Selected delimiter: Tab 2000 2010 State Total Hispanic Total Hispanic Georgia 8,105,866 434,765 9,687,872 853,464 Michigan 9,939, 751 323,871 9,883,104 436,458 California 33,875,209 10,966,278 37,254,445 14,0 Done Enter your answer in the edit fields and then click Check

Step by Step Solution

There are 3 Steps involved in it

1 Expert Approved Answer
Step: 1 Unlock blur-text-image
Question Has Been Solved by an Expert!

Get step-by-step solutions from verified subject matter experts

Step: 2 Unlock
Step: 3 Unlock

Students Have Also Explored These Related General Management Questions!