

Question: The U.S. Census Bureau provides considerable demographic information that is useful for marketers. Assume that the following table provides a sample of such population data.


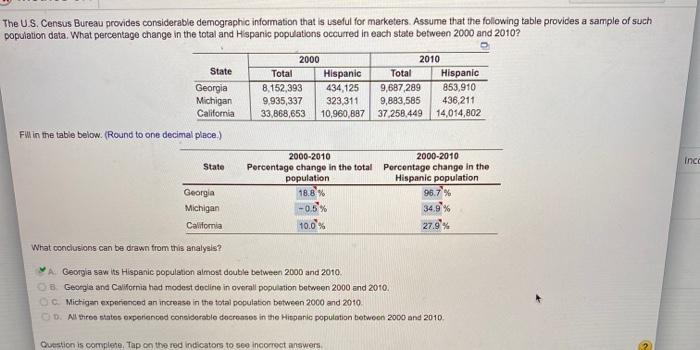
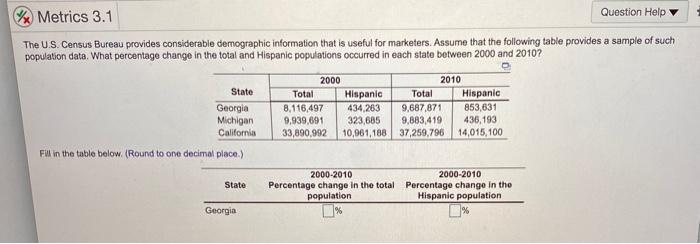
The U.S. Census Bureau provides considerable demographic information that is useful for marketers. Assume that the following table provides a sample of such population data. What percentage change in the total and Hispanic populations occurred in each state between 2000 and 2010? State Georgia Michigan California 2000 Total Hispanic 8.152,393 434 125 9,935,337 323,311 33,868,653 10,960,887 2010 Total Hispanic 9,687,289 853,910 9,883,585 436,211 37,258,449 14,014,802 FW in the table below. (Round to one decimal place) Ince State Georgia Michigan California 2000-2010 2000-2010 Porcentage change in the total Porcentage change in the population Hispanic population 18.8% 96.7 -0.5% 10.0 % 27.9 What conclusions can be drawn from this analysis? A Georgia saw its Hispanic population almost double between 2000 and 2010 B Georgia and California had modest decline in overall population between 2000 and 2010 Michigan experienced an increase in the total population between 2000 and 2010 D. All the states experienced considerable decreases in the Hispanic population betwoon 2000 and 2010 Question is complete. Tap on the red indicators to see incorrect answers Metrics 3.1 Question Help The U.S. Census Bureau provides considerable demographic information that is useful for marketers. Assume that the following table provides a sample of such population data. What percentage change in the total and Hispanic populations occurred in each state between 2000 and 2010? State Georgia Michigan California 2000 2010 Total Hispanic Total Hispanic 8,116,497 434,263 9,687,871 853,631 9,939,691 323,685 9,883,419 436,193 33,890,992 10,961,188 37,259,796 14,015,100 Fill in the table below. (Round to one decimal place) State 2000-2010 2000-2010 Percentage change in the total Percentage change in the population Hispanic population Georgia
Step by Step Solution
There are 3 Steps involved in it

Get step-by-step solutions from verified subject matter experts