

Question: Microsoft Excel File Edit View Insert Format Tools a Window Help G Q 8 Fri Mar 8 1:05PM AutoSave OFF 1 - G ... PSY

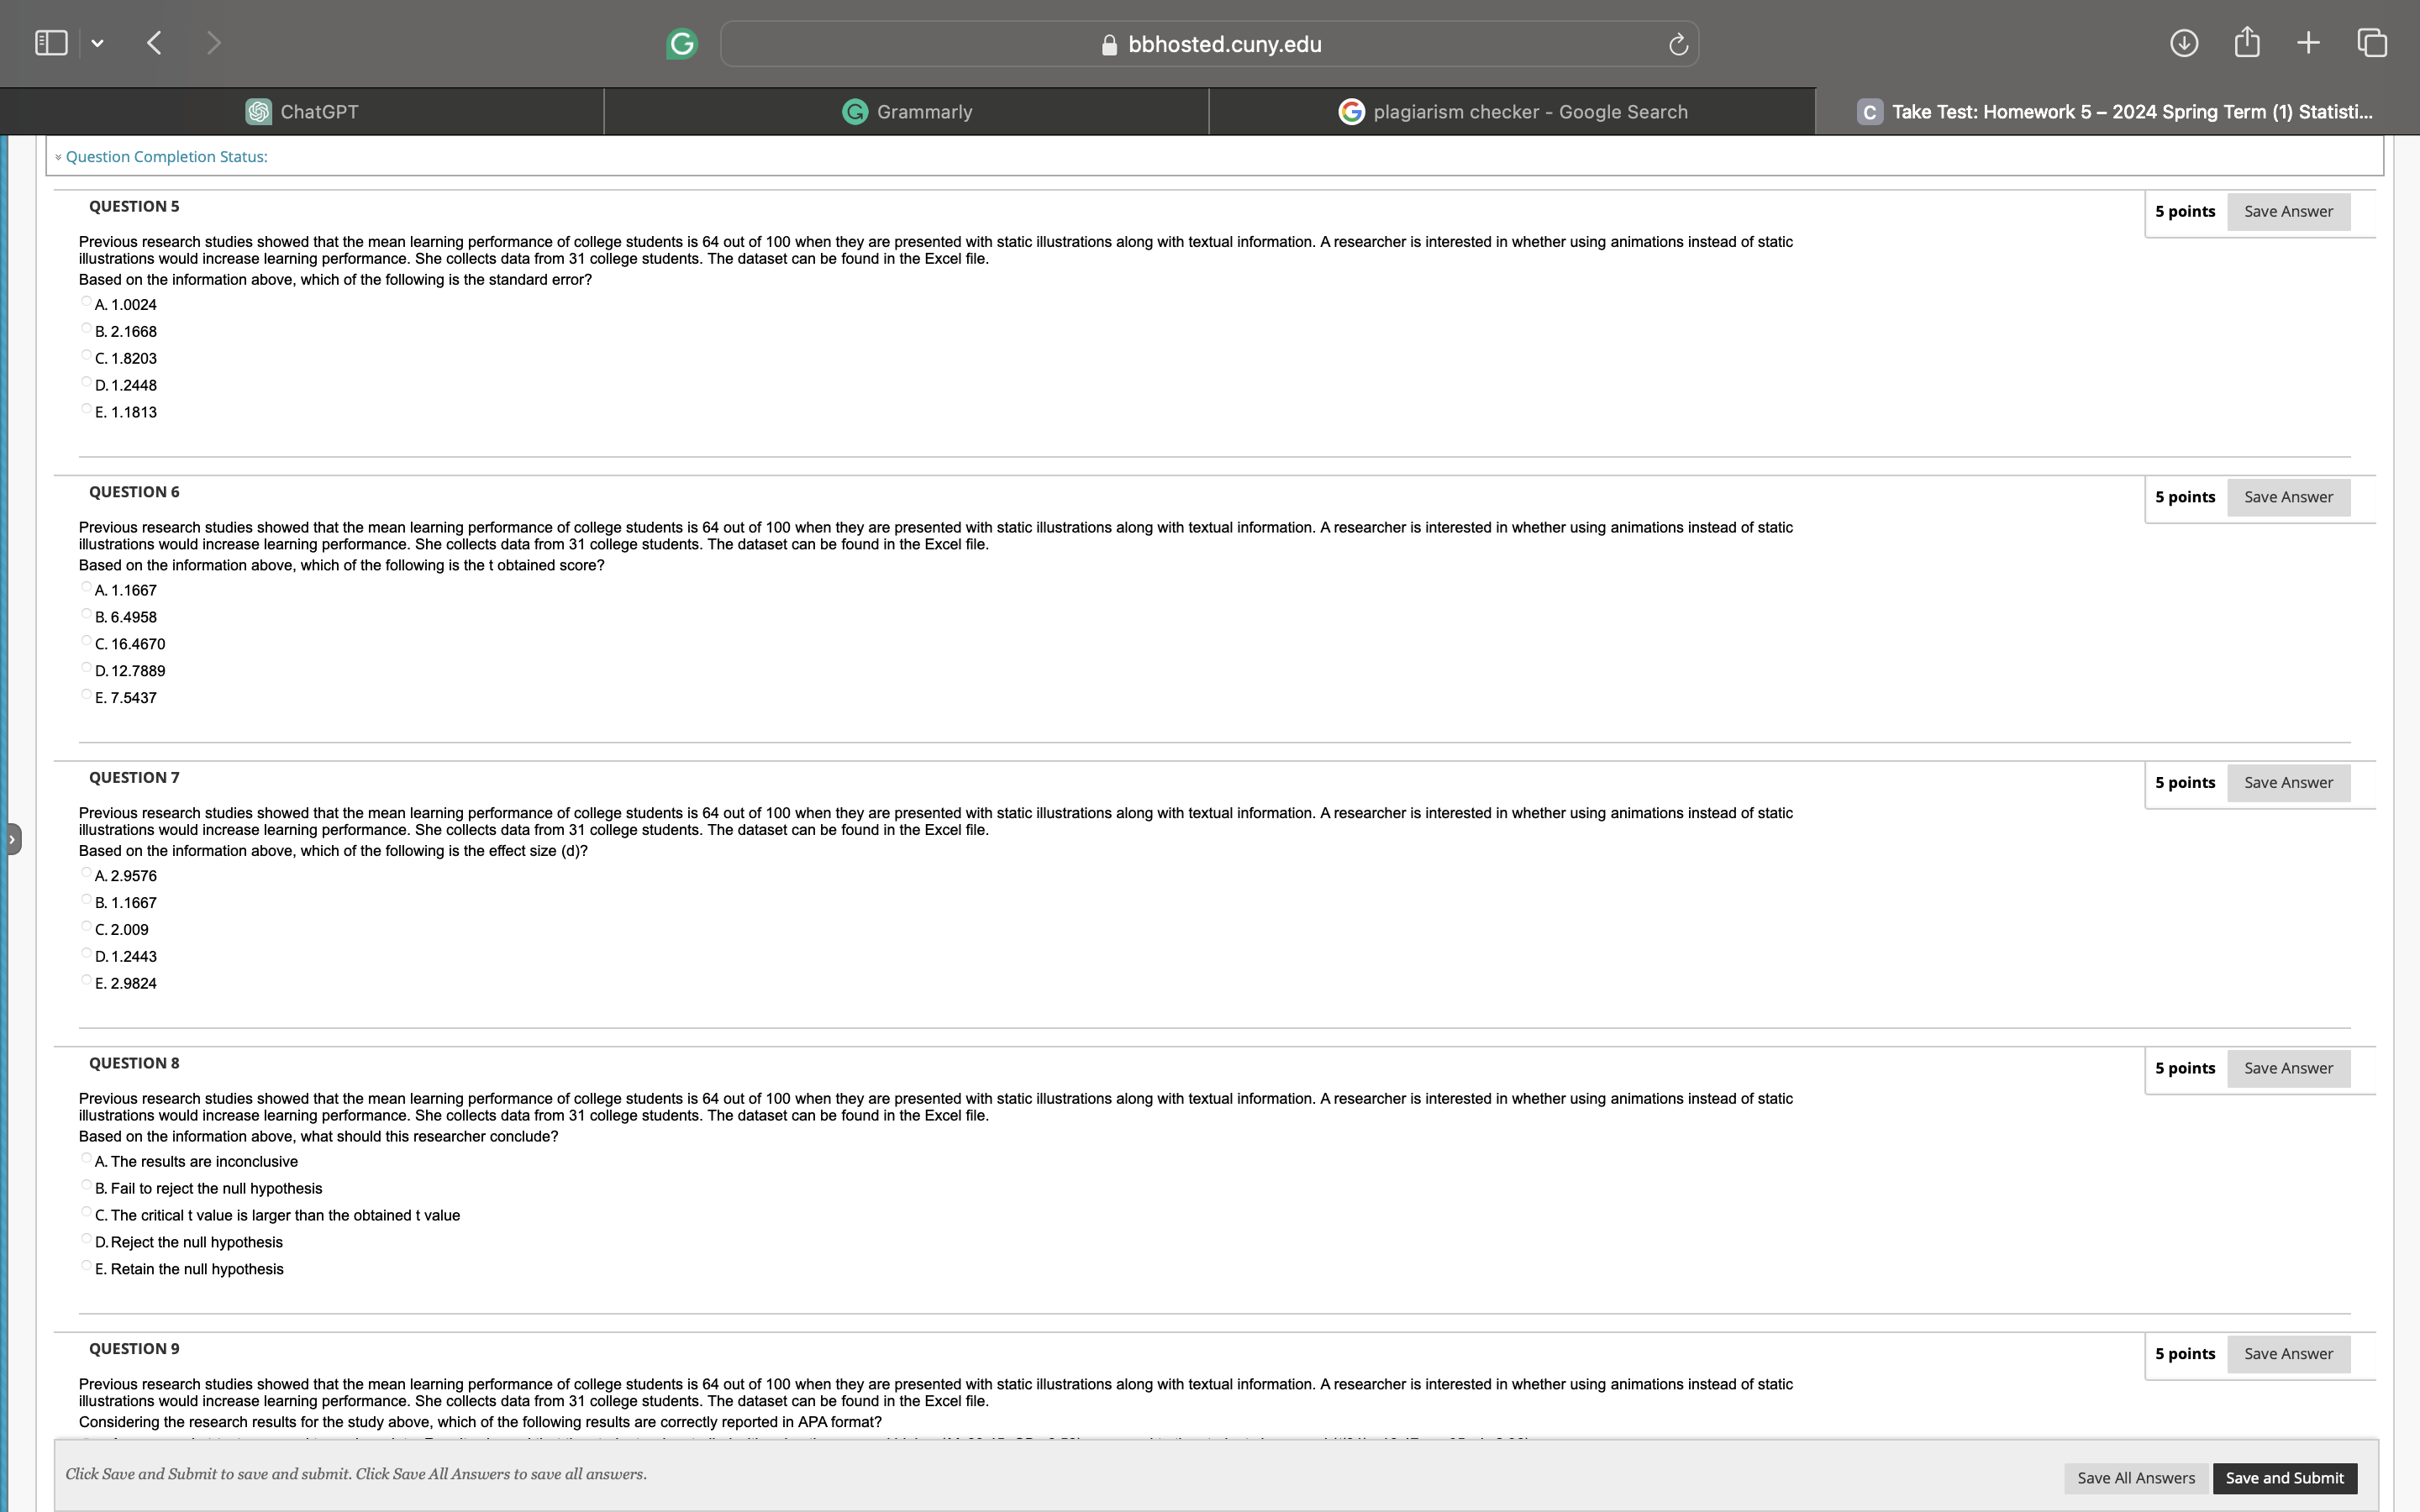
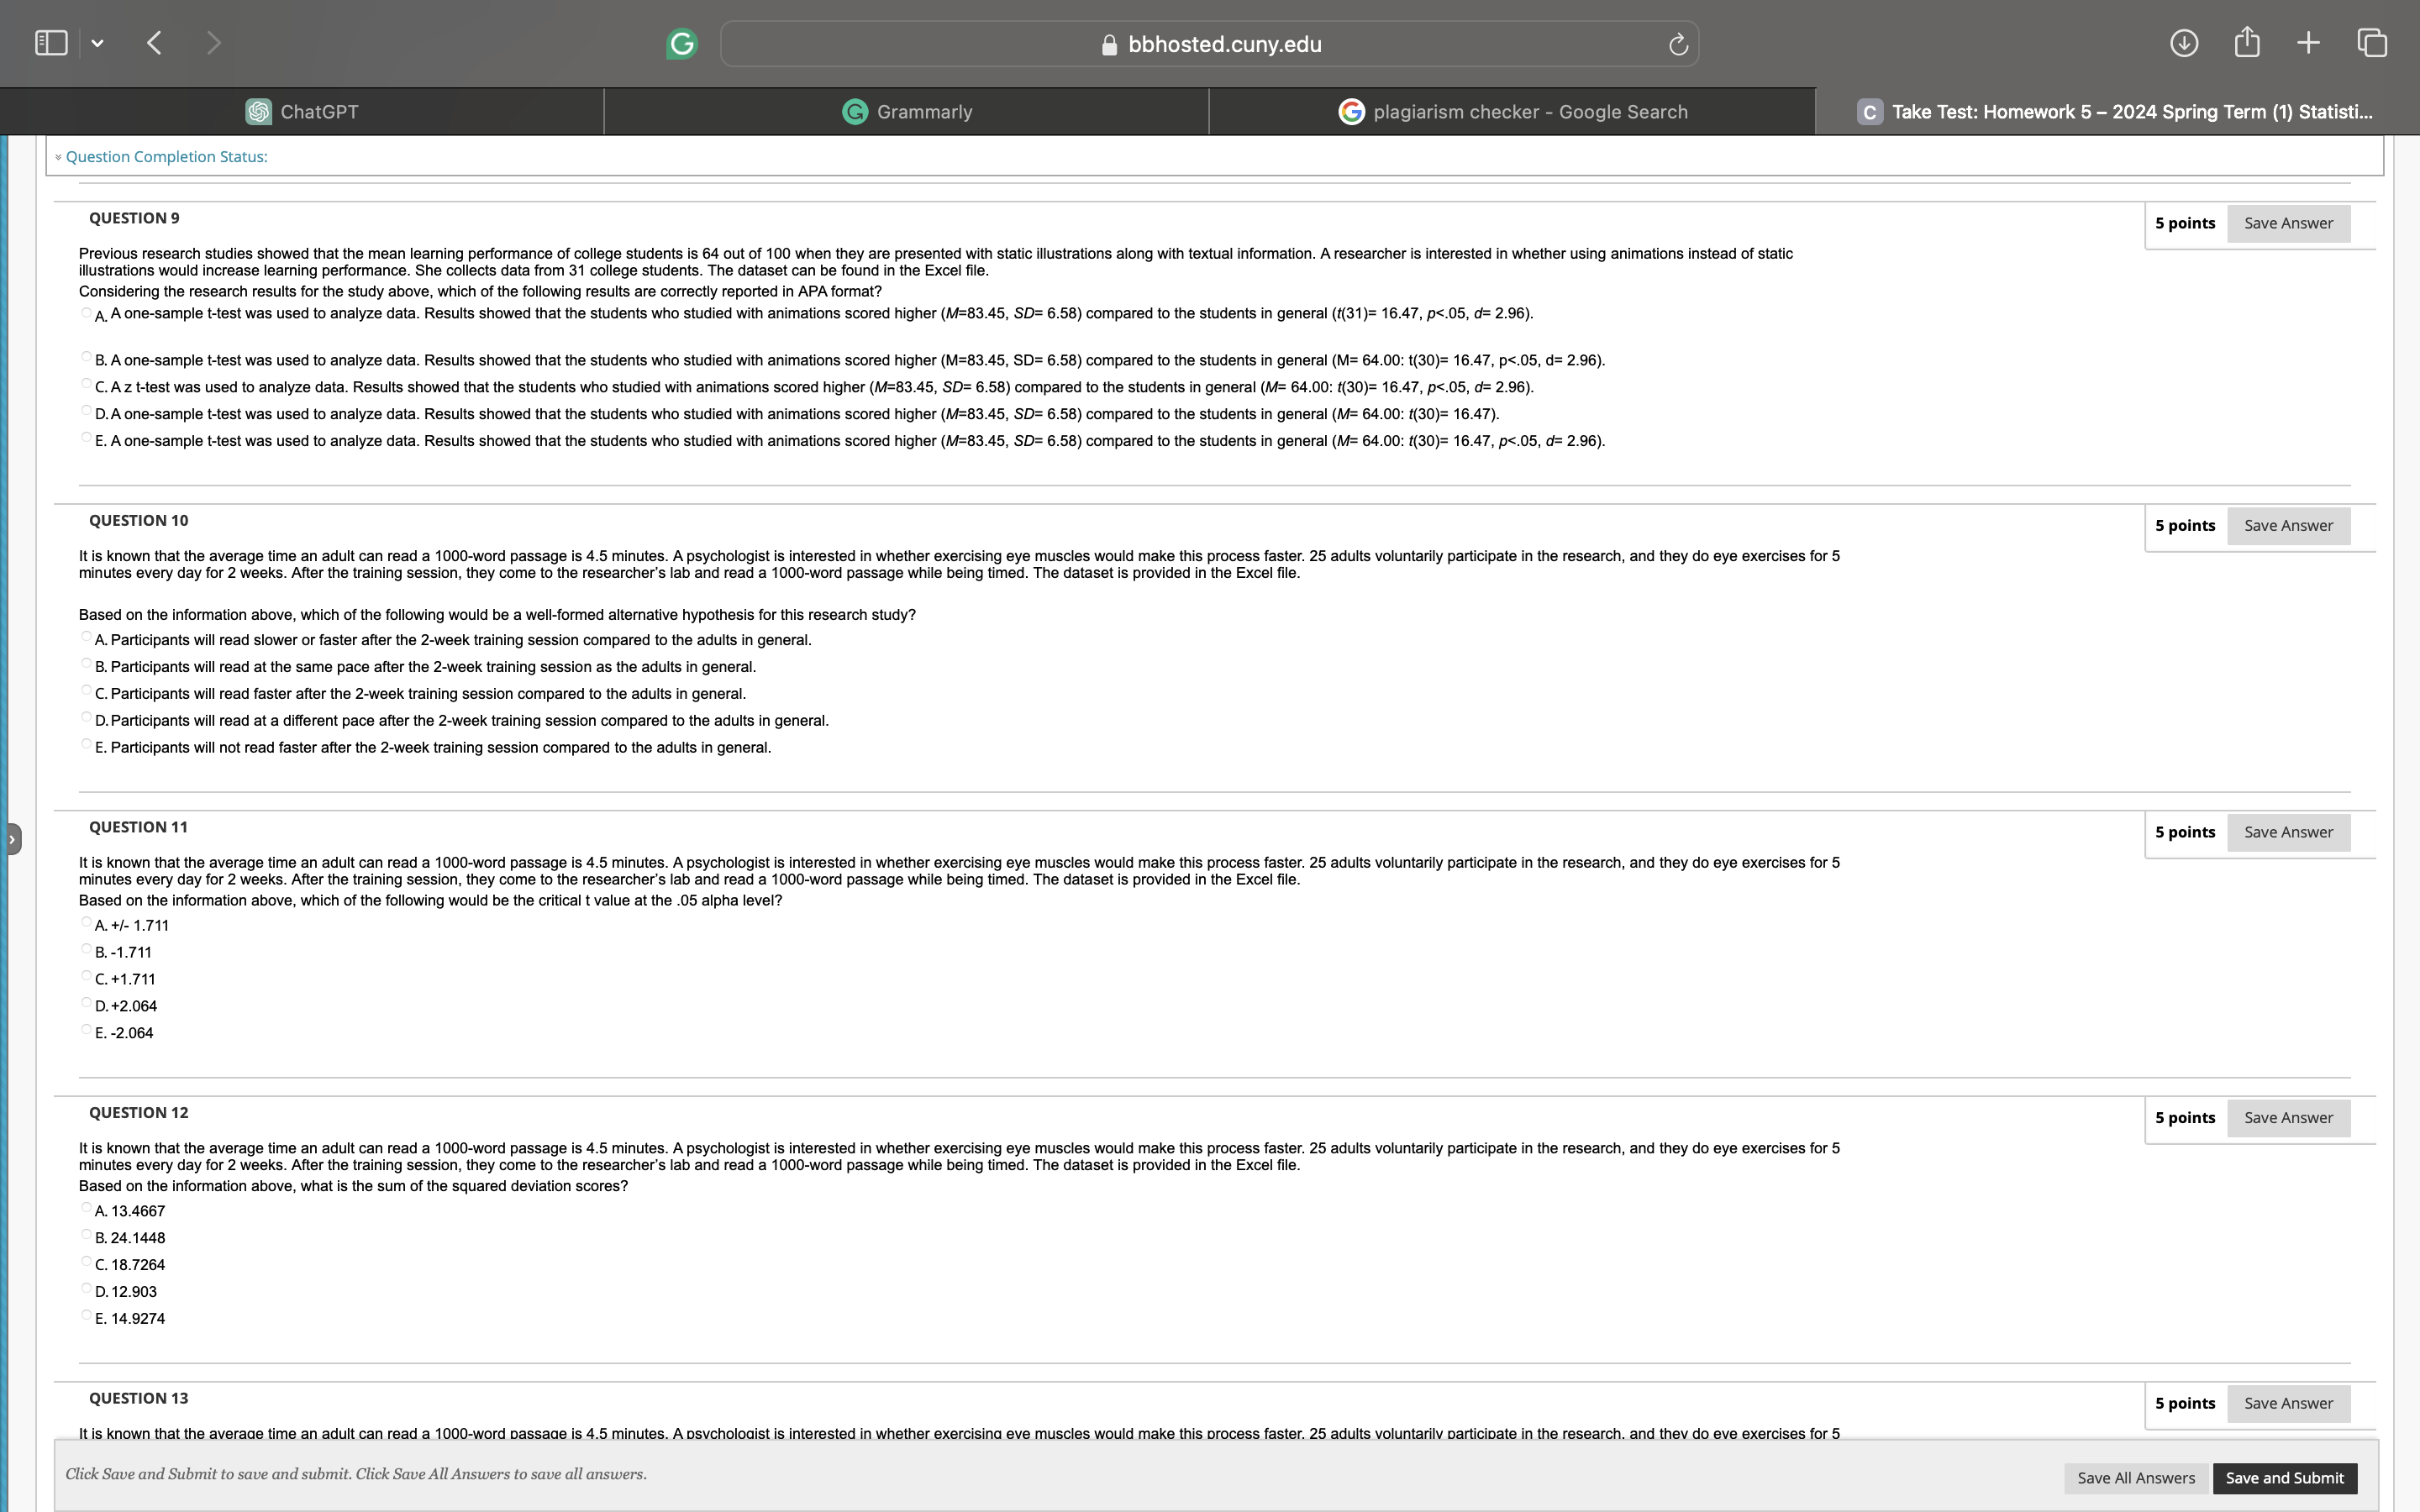
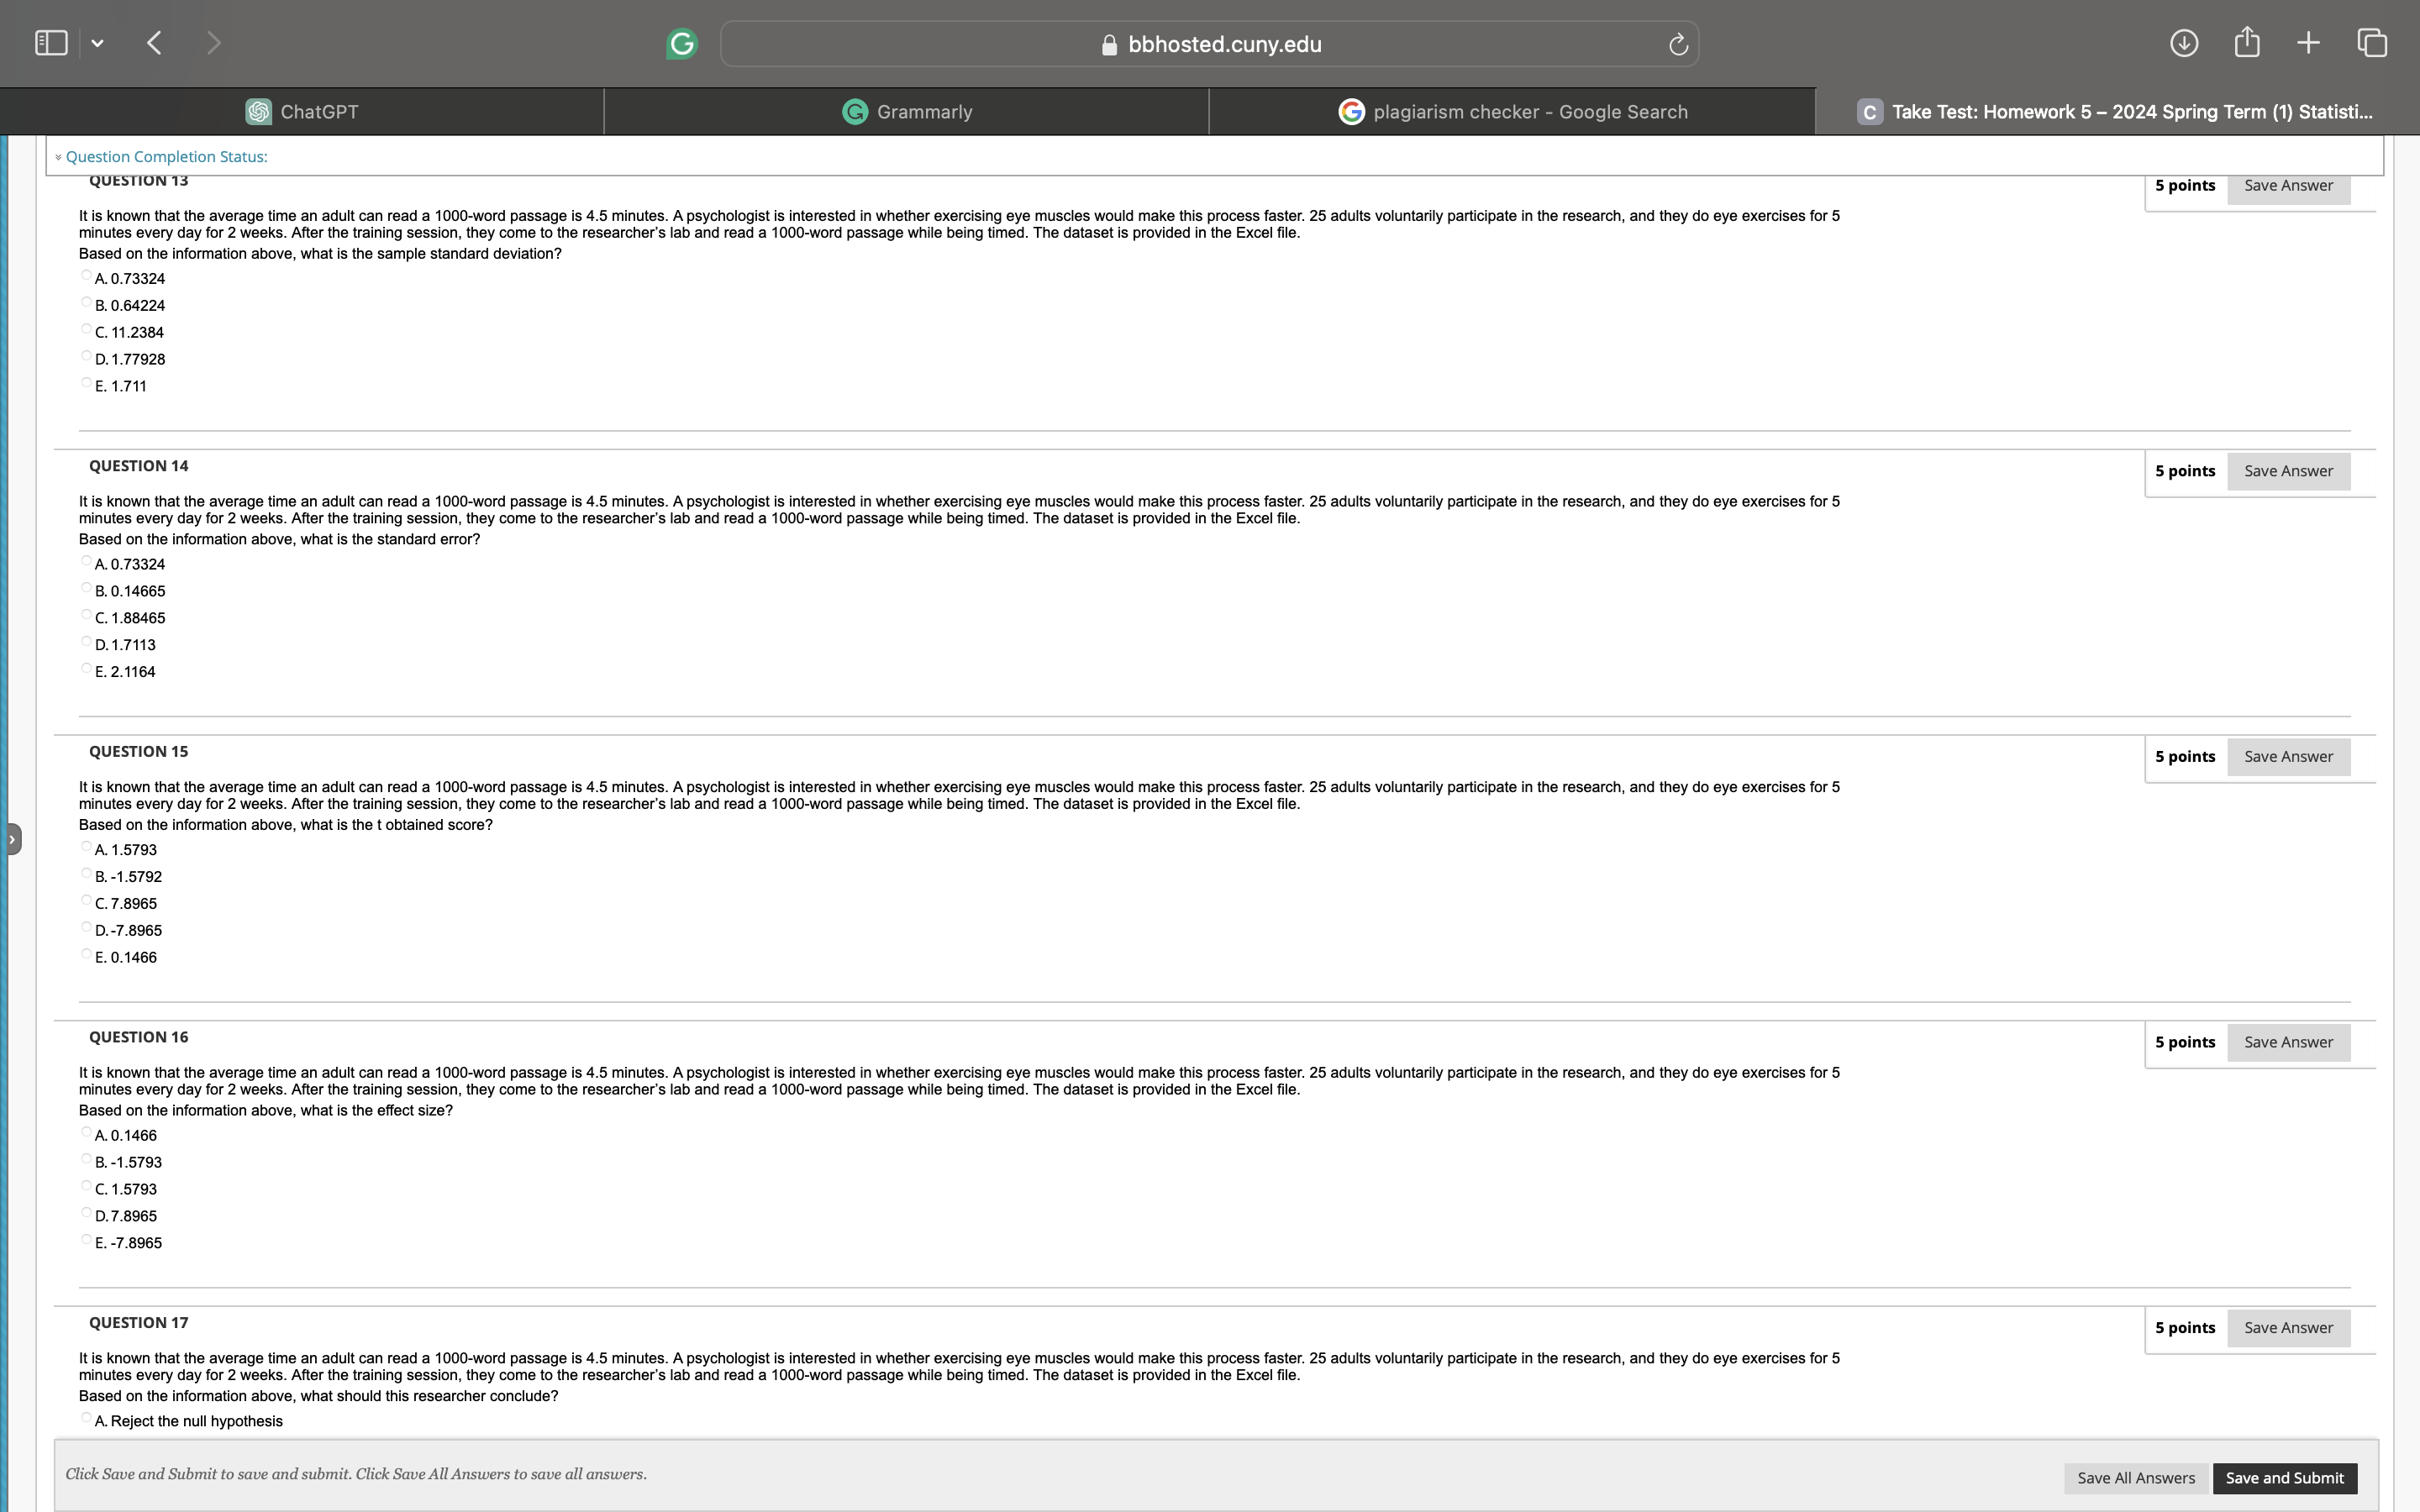
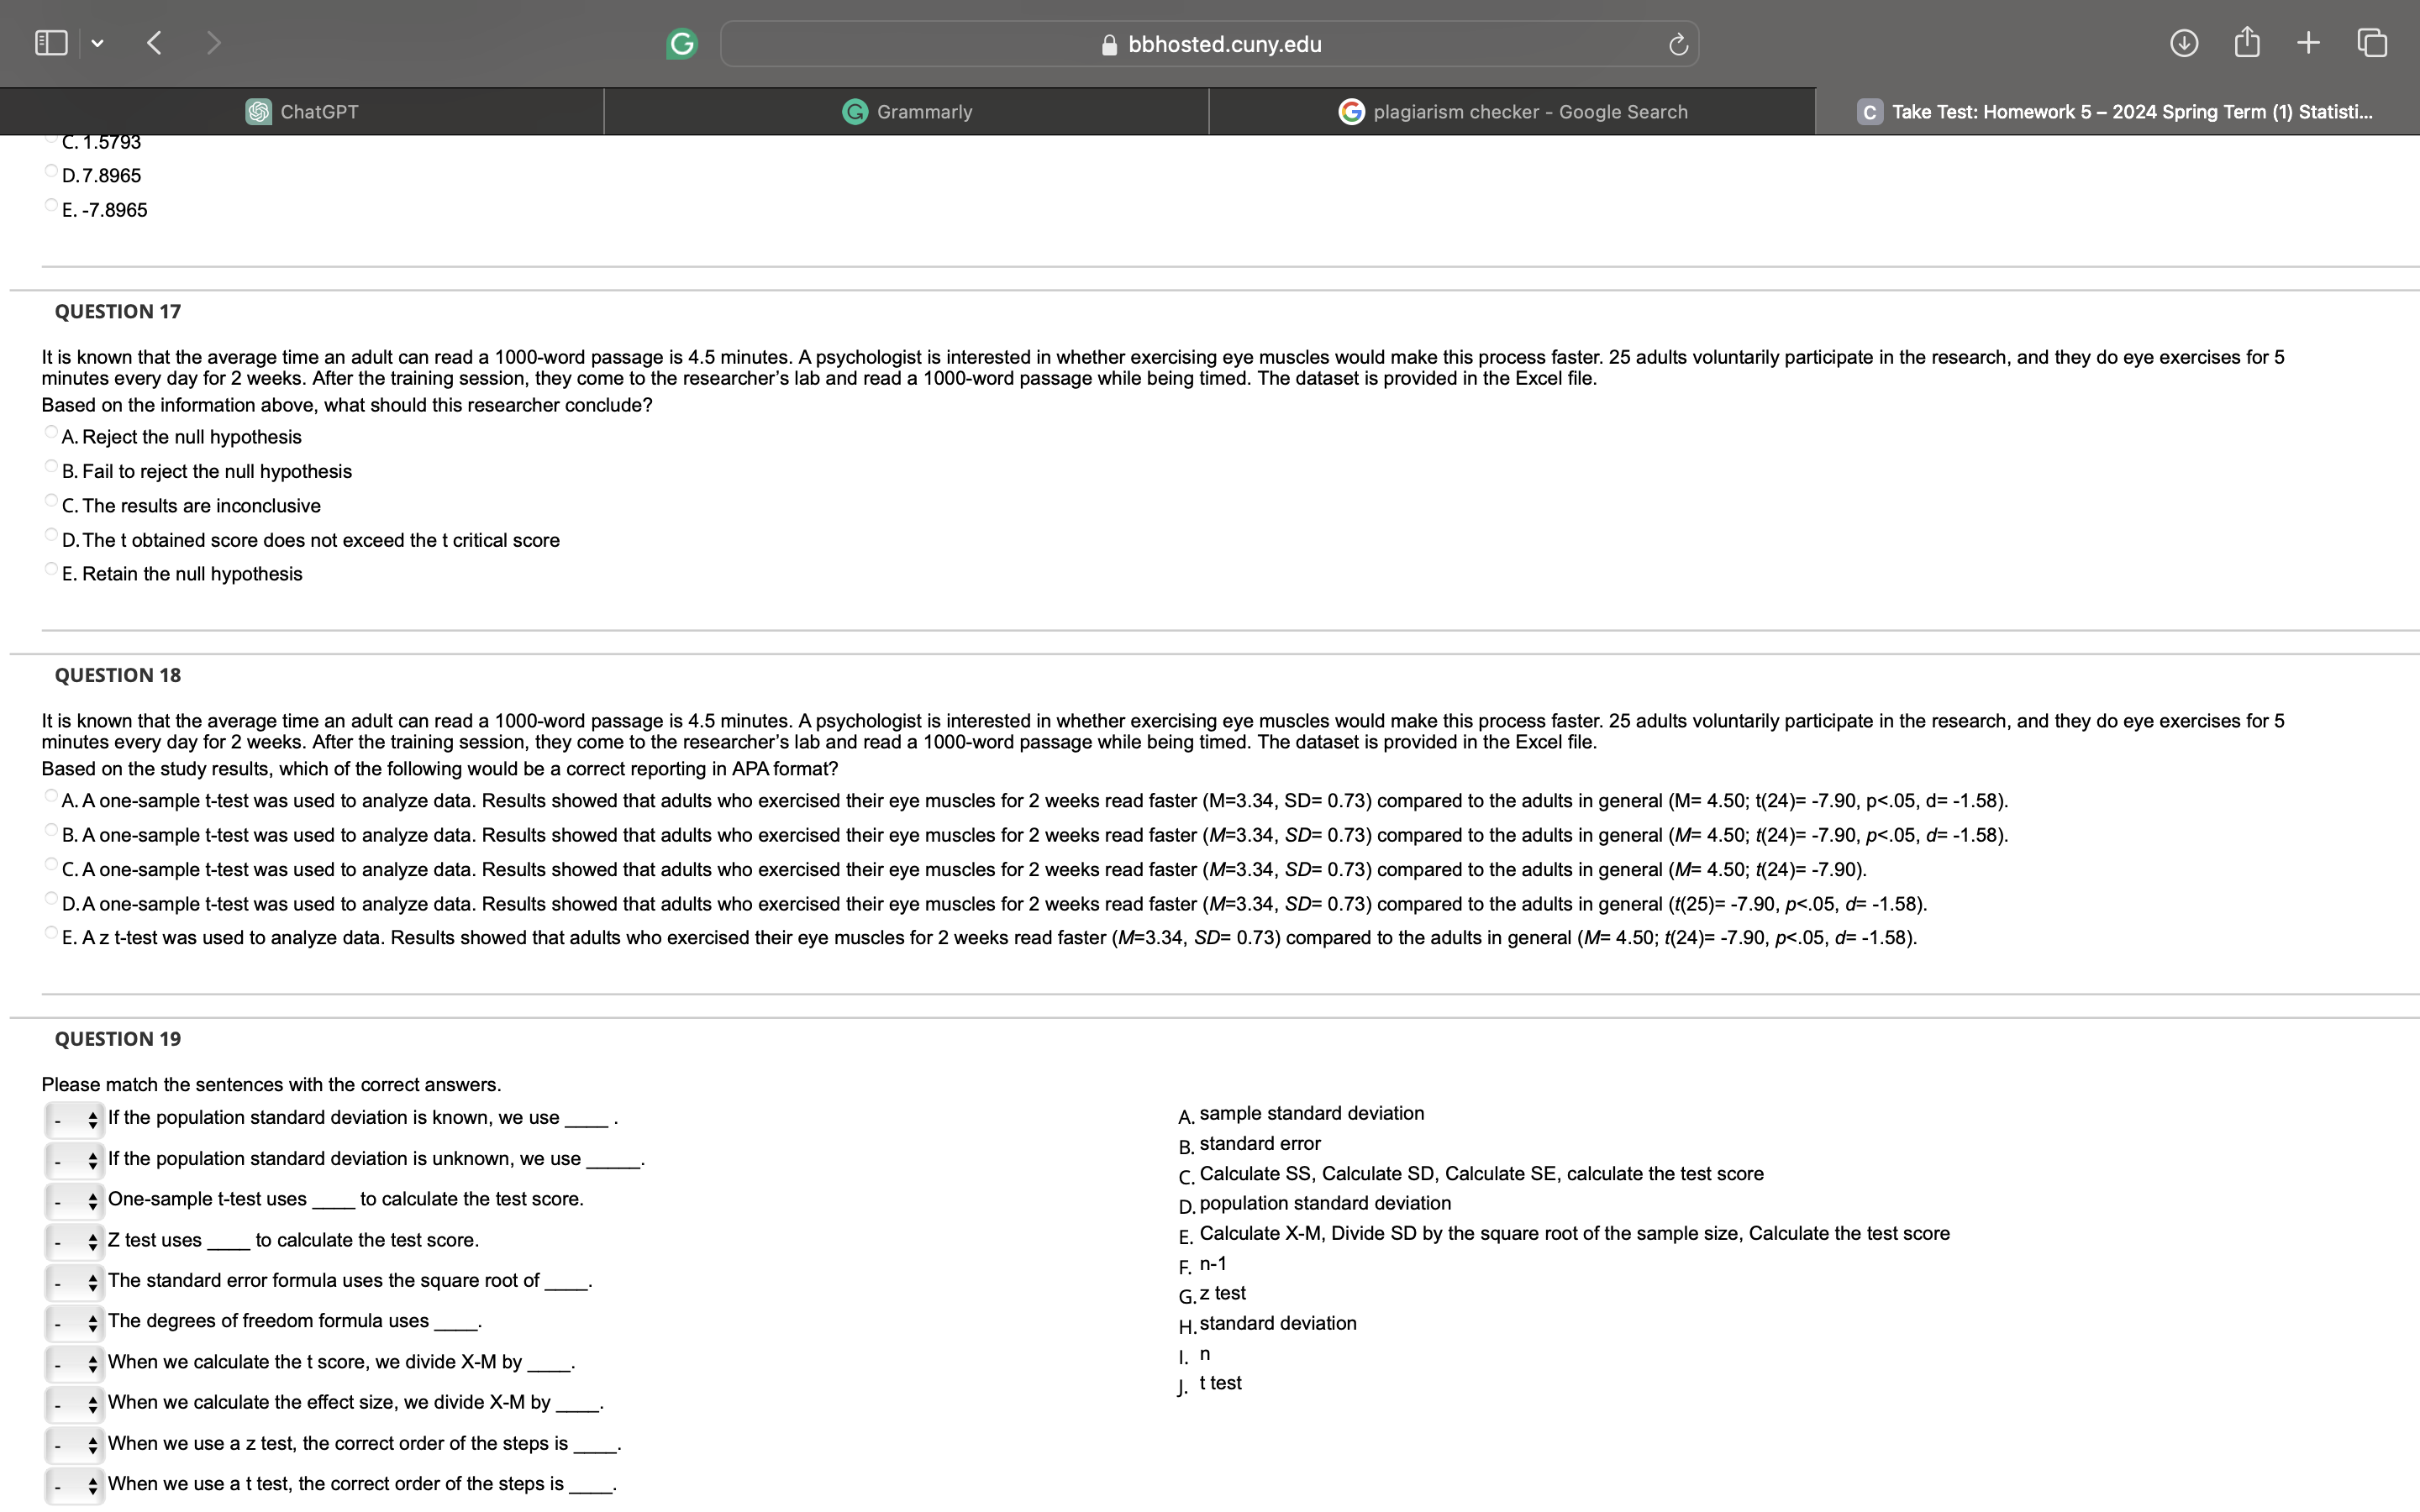
Microsoft Excel File Edit View Insert Format Tools a Window Help G Q 8 Fri Mar 8 1:05PM AutoSave OFF 1 - G ... PSY 226 HW 5 Learning Performance Dataset(1) (1) ~ Q Home Insert Draw Page Layout Formulas Data Review View Automate Tell me Comments Share Calibri (Body) 12 AA B Wrap Text v General Insert v AYOU x Delete Paste BIUv A Merge & Center v ~ % " Conditional Format Cell Sort & Find & Sensitivity Analyze Formatting as Table Styles Format v Filter Select Data C19 X V fx A B C D E F G H K L M N P 2 R S Learning_Performance 78 87 69 82 88 79 81 92 Learning Performance + Ready Accessibility: Good to go + 100% MAR 8 @ali a@ bbhosted.cuny.edu @ fb 7 @ C Take Test: Homework 5 2024 Spring Term (1) Statisti ' Question Completion Status: QUESTION 5 5points Save Answer Previous research studies showed that the mean learning performance of college students is 64 out of 100 when they are presented with static illustrations along with textual information. A researcher is interested in whether using animations instead of static illustrations would increase learning performance. She collects data from 31 college students. The dataset can be found in the Excel file. Based on the information above, which of the following is the standard error? A.1.0024 B.2.1668 C.1.8203 D.1.2448 E.1.1813 QUESTION 6 5points Save Answer Previous research studies showed that the mean leaming performance of college students is 64 out of 100 when they are presented with static ilustrations along with textual information. A researcher is interested in whether using animations instead of static illustrations would increase learning performance. She collects data from 31 college students. The dataset can be found in the Excel file. Based on the information above, which of the following is the t obtained score? A.1.1667 B.6.4958 C.16.4670 D.12.7889 E.7.5437 QUESTION 7 Spoints Save Answer Previous research studies showed that the mean learning performance of college students is 64 out of 100 when they are presented with static llustrations along with textual information. A researcher is interested in whether using animations instead of static B illustrations would increase learning performance. She collects data from 31 college students. The dataset can be found in the Excel file. Based on the information above, which of the following s the effect size (d)? A.2.9576 B.1.1667 .2.009 D.1.2443 E.2.9824 QUESTION 8 5points Save Answer Previous research studies showed that the mean learning performance of college students is 64 out of 100 when they are presented with static llustrations along with textual information. A researcher is interested in whether using animations instead of static illustrations would increase learning performance. She collects data from 31 college students. The dataset can be found in the Excel file. Based on the information above, what should this researcher conclude? A The results are inconclusive 8. Fail to reject the null hypothesis C.The critical t value is larger than the obtained t value D.Reject the null hypothesis . Retain the null hypothesis QUESTION 9 Spoints Save Answer Previous research studies showed that the mean learning performance of college students is 64 out of 100 when they are presented with static illustrations along with textual information. A researcher is interested in whether using animations instead of static illustrations would increase learing performance. She collects data from 31 college students. The dataset can be found in the Excel file. Considering the research results for the study above, which of the following resuits are correctly reported in APA format? Click Save and Submit to save and submit. Click Save All Answers to save all answers. Save All Answers [ICEWVSERRENGIIE v G bbhosted.cuny.edu C + ChatGPT G Grammarly G plagiarism checker - Google Search C Take Test: Homework 5 - 2024 Spring Term (1) Statisti. * Question Completion Status: QUESTION 9 5 points Save Answer Previous research studies showed that the mean learning performance of college students is 64 out of 100 when they are presented with static illustrations along with textual information. A researcher is interested in whether using animations instead of static ilustrations would increase learning performance. She collects data from 31 college students. The dataset can be found in the Excel file. Considering the research results for the study above, which of the following results are correctly reported in APA format? A. A one-sample t-test was used to analyze data. Results showed that the students who studied with animations scored higher (M=83.45, SD= 6.58) compared to the students in general (t(31)= 16.47, p<.05 d="2.96)." b. a one-sample t-test was used to analyze data. results showed that the students who studied with animations scored higher sd="6.58)" compared in general t p c. z cored d. stud e. question points save answer it is known average time an adult can read passage minutes. psychologist interested whether exercising eye muscles would make this process faster. adults voluntarily participate research and they do exercises for minutes every day weeks. after training session come researcher lab while being timed. dataset provided excel file. based on information above which of following be well-formed alternative hypothesis study a. participants will slower or faster ession at same pace n as general. o genera different sion not critical value .05 alpha level what sum squared deviation scores eve research. click submit submit. all answers answers. bbhosted.cuny.edu fb c take test: homework spring term statisti completion status: t3 itis fle. sample standard a.0.73324 b.0.64224 c.11.2384 d.1.77928 error b.0.14665 c.1.88465 d713 e.2.1164 obtained score a.15793 b.-15792 c.7.8965 d.-7.8965 e.0.1466 effect size a.0.1466 b.-1.5793 c.15793 d.7.8965 e.-7.8965 spoints should conclude a.reject null f statisti... fail reject c.the are inconclusive d.the does exceed retain correct reporting apa format a.aone-sample exercised their weeks c.aone-sample d.a az please match sentences ifthe population we use unknown .="PP" calculate ss se test uses score. ztestuses x-m divide by square root n-1 formula : b g.ztest degrees freedom h.standard when l0y j. ttest order steps>
Step by Step Solution
There are 3 Steps involved in it

Get step-by-step solutions from verified subject matter experts