

Question: Microsoft PowerPoint ( 1 0 Marks ) Open a new PowerPoint application IFS 1 1 3 E 2 0 2 4 a ) On the
Microsoft PowerPoint Marks
Open a new PowerPoint application
IFSE
a On the cover page, write the title: Value of Bitcoin in Also put the student numbers of all group members.
b On the second slide, display the bar chart that you created on the spreadsheet. Resize it so that is fits properly and neatly
c Format the colour scheme or the design of the slides so that it looks appealing. Ensure that your colour scheme or design does not diminish the visibility of your chart or any other text on the slides.
d Add page numbers to your slides.
Graphs and Charts Marks
a Using the data in Columns and create a Clustered Column Bar Chart to compare the opening and closing values of Bitcoin during the month of April.
b Using your calculated values in column G create a D line chart that will show the fluctuation of the closing value of Bitcoin from January to April Create the chart next to the main table, below the Average Closing Value.
c Edit the chart area so that it displays:
I. The correct values on the horizontal axis dates
II The legend to the right of the chart
III. An appropriate chart title you name it
Microsoft PowerPoint Marks
Open a new PowerPoint application
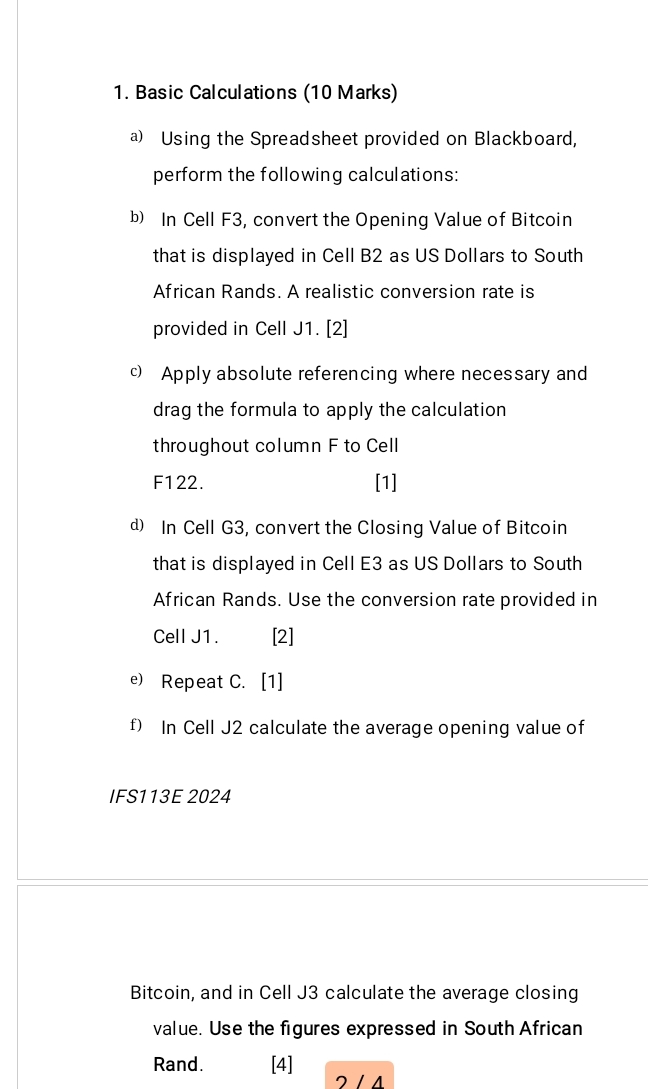
Basic Calculations Marks
a Using the Spreadsheet provided on Blackboard, perform the following calculations:
b In Cell F convert the Opening Value of Bitcoin that is displayed in Cell B as US Dollars to South African Rands. A realistic conversion rate is provided in Cell J
c Apply absolute referencing where necessary and drag the formula to apply the calculation throughout column to Cell F
d In Cell G convert the Closing Value of Bitcoin that is displayed in Cell E as US Dollars to South African Rands. Use the conversion rate provided in Cell J
e Repeat C
f In Cell J calculate the average opening value of
IFSE
Bitcoin, and in Cell J calculate the average closing value. Use the figures expressed in South African Rand.
Step by Step Solution
There are 3 Steps involved in it
1 Expert Approved Answer
Step: 1 Unlock

Question Has Been Solved by an Expert!
Get step-by-step solutions from verified subject matter experts
Step: 2 Unlock
Step: 3 Unlock