

Question: Microsoft project What do the gray Gantt Bars indicate in the image? 6 4/10 5/28 10% 0% Q4 Image Non-critical Tasks Baseline values O Negative
Microsoft project
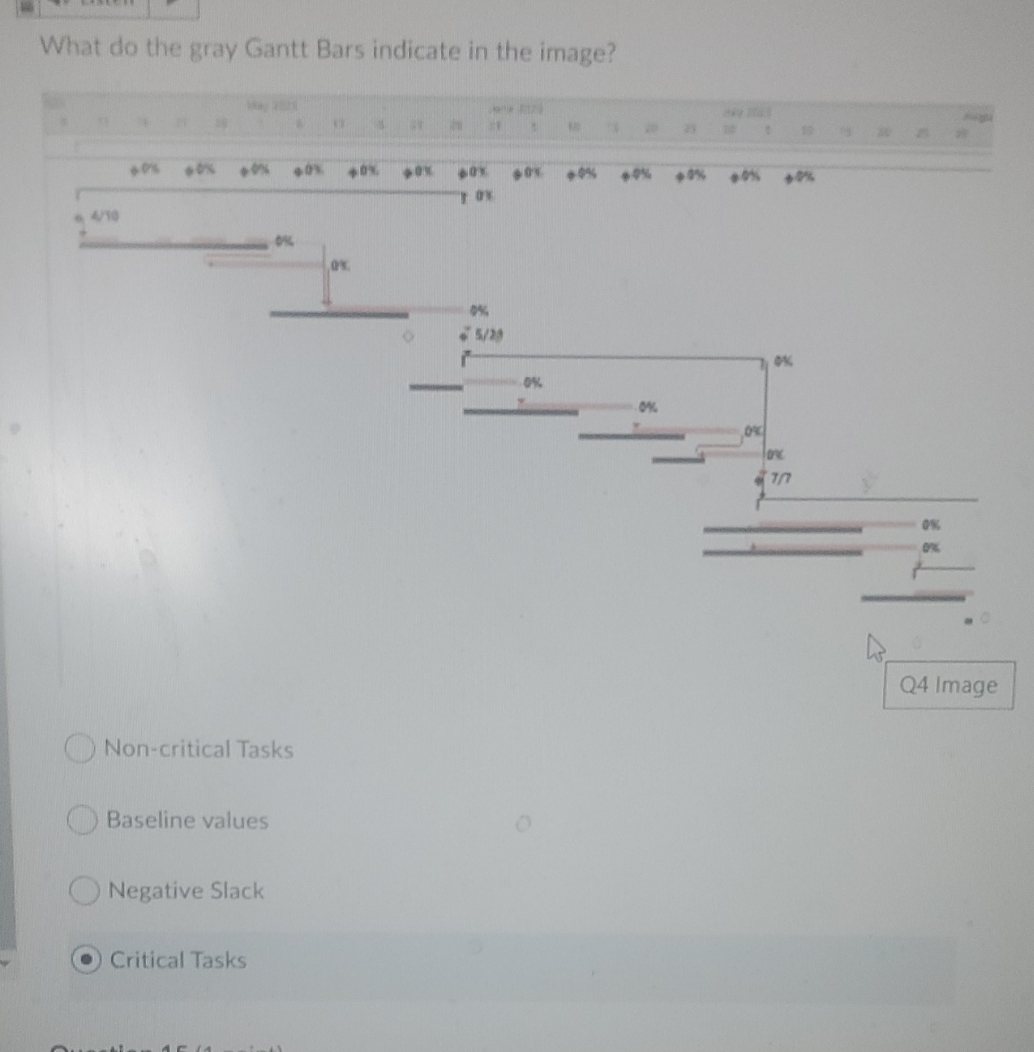
What do the gray Gantt Bars indicate in the image? 6 4/10 5/28 10% 0% Q4 Image Non-critical Tasks Baseline values O Negative Slack Critical Tasks
Step by Step Solution
There are 3 Steps involved in it
1 Expert Approved Answer
Step: 1 Unlock

Question Has Been Solved by an Expert!
Get step-by-step solutions from verified subject matter experts
Step: 2 Unlock
Step: 3 Unlock