

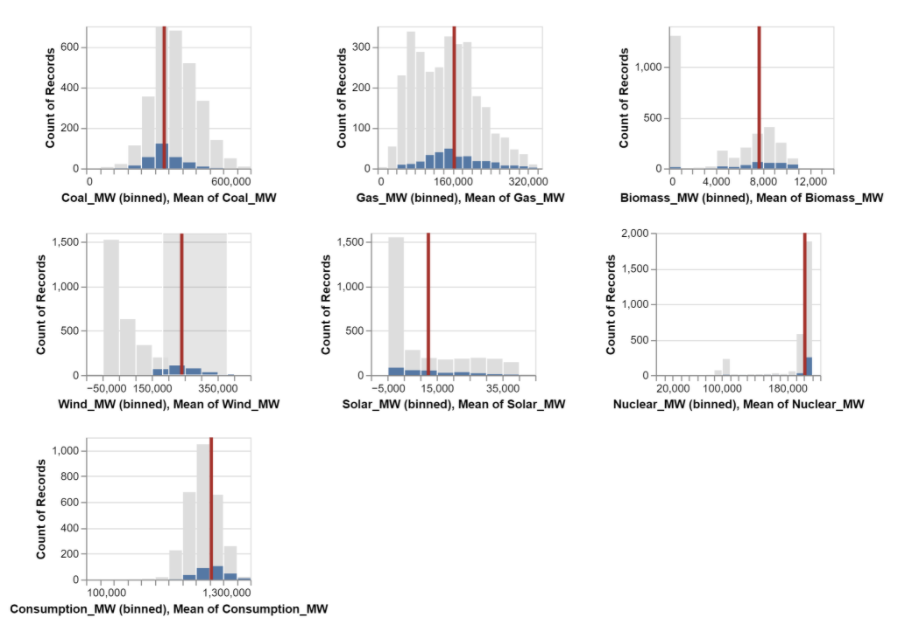
Question: Modify interaction.ipynb (shown below) to create an interval selection and another row of charts for Wind, Solar and Nuclear. The new visualization should look like
Modify interaction.ipynb (shown below) to create an interval selection and another row of charts for Wind, Solar and Nuclear. The new visualization should look like this:
interaction.ipynb
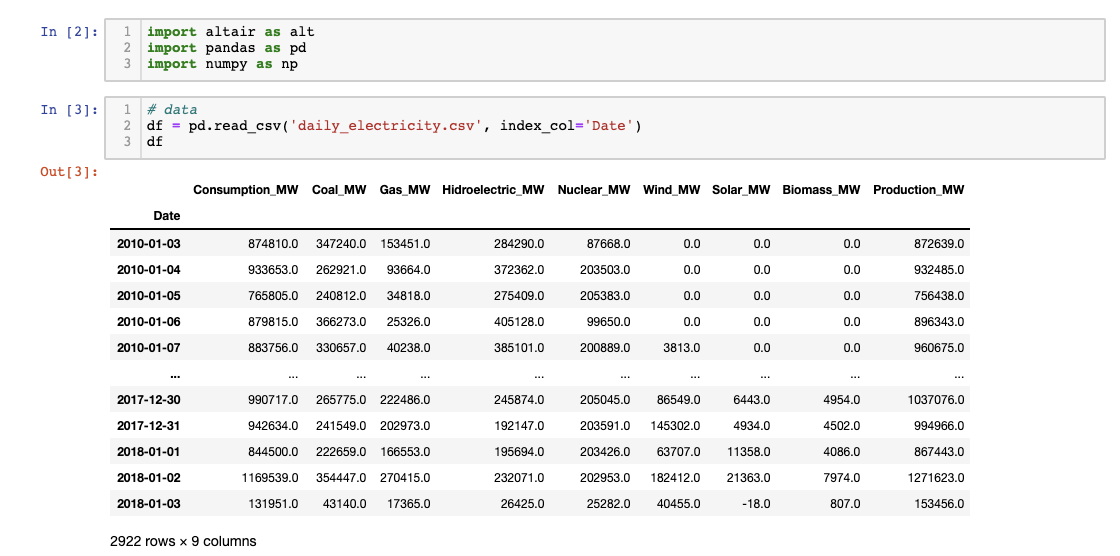
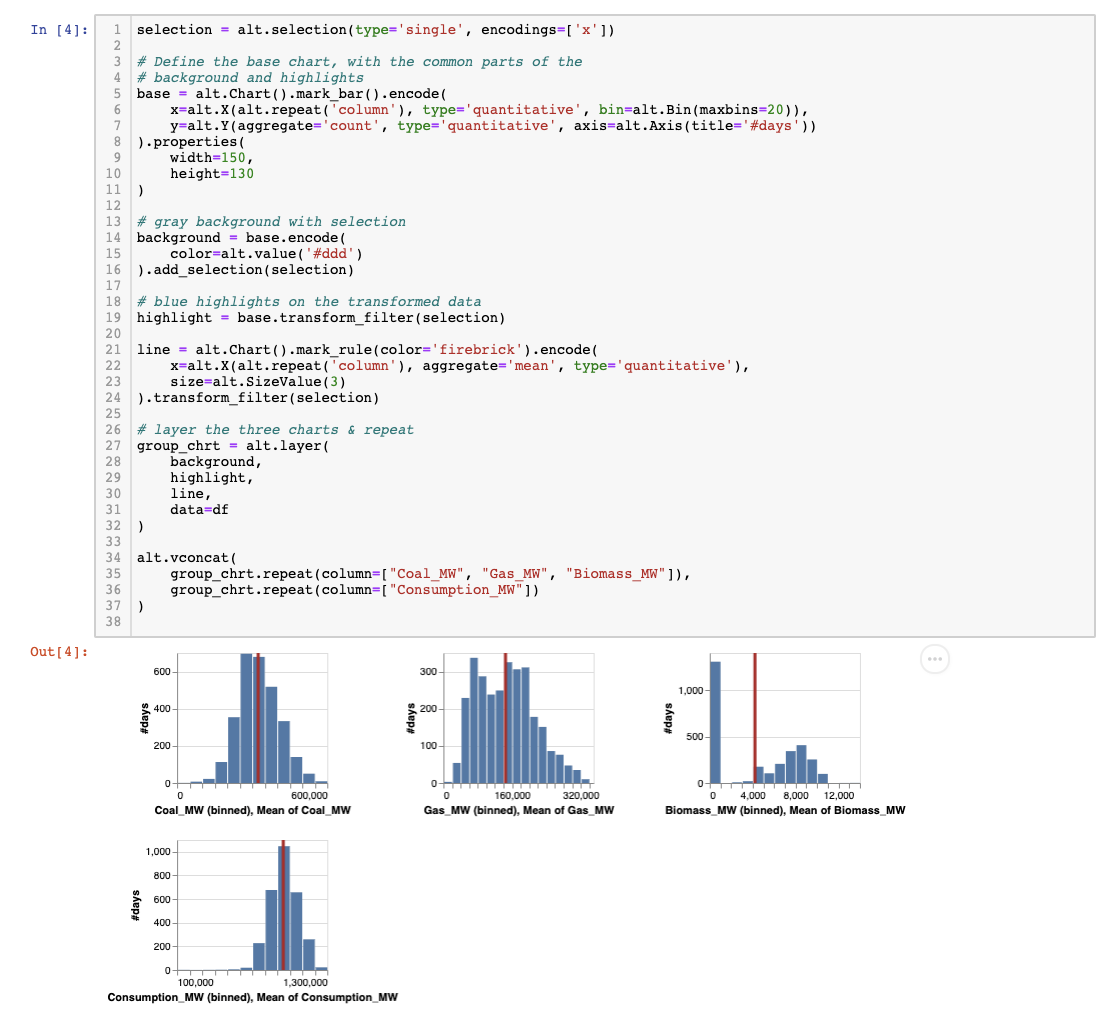
600 300 1,000 400 200 Count of Records 500 200 100 0 600,000 Coal_MW (binned), Mean of Coal_MW 160,000 320,000 Gas_MW (binned), Mean of Gas_MW 0 4,000 8,000 12,000 Biomass_MW (binned), Mean of Biomass_MW 2,000 1,500 1,500 1,500 1,000 1,000 Count of Records 1,000 500 500 500 0- -50,000 150,000 350,000 Wind_MW (binned), Mean of Wind_MW -5,000 15,000 35,000 Solar_MW (binned), Mean of Solar_MW 0+ 20,000 100.000 180,000 Nuclear_MW (binned), Mean of Nuclear_MW 1,000 800 600 Count of Records 400- 200 0 100,000 1,300,000 Consumption_MW (binned), Mean of Consumption_MW In [2] : 1 import altair as alt 2 import pandas as pd 3 import numpy as np In [3]: 1 # data 2 df = pd. read_csv('daily_electricity.csv', index_col='Date') 3 df Out[3]: Consumption_MW Coal_MW Gas_MW Hidroelectric_MW Nuclear_MW Wind_MW Solar_MW Biomass_MW Production_MW Date 2010-01-03 874810.0 347240.0 153451.0 284290.0 87668.0 0.0 0.0 0.0 872639.0 2010-01-04 933653.0 262921.0 93664.0 372362.0 203503.0 0.0 0.0 0.0 932485.0 2010-01-05 765805.0 240812.0 34818.0 275409.0 205383.0 0.0 0.0 0.0 756438.0 2010-01-06 879815.0 366273.0 25326.0 405128.0 99650.0 0.0 0.0 0.0 896343.0 2010-01-07 883756.0 330657.0 40238.0 385101.0 200889.0 3813.0 0.0 0.0 960675.0 . .. 2017-12-30 990717.0 265775.0 222486.0 245874.0 205045.0 86549.0 6443.0 4954.0 1037076.0 2017-12-31 942634.0 241549.0 202973.0 192147.0 203591.0 145302.0 4934.0 4502.0 994966.0 2018-01-01 844500.0 222659.0 166553.0 195694.0 203426.0 63707.0 11358.0 4086.0 867443.0 2018-01-02 1169539.0 354447.0 270415.0 232071.0 202953.0 182412.0 21363.0 7974.0 1271623.0 2018-01-03 131951.0 43140.0 17365.0 26425.0 25282.0 40455.0 -18.0 807.0 153456.0 2922 rows x 9 columns In [4]: 2 3 4 ) 1 selection = alt.selection (type='single', encodings=[ 'x']) # Define the base chart, with the common parts of the # background and highlights base = alt. Chart().mark_bar().encode 6 x=alt.X(alt.repeat ("column), type=' quantitative', bin=alt.Bin (maxbins=20)), 7 y=alt.Y(aggregate='count', type='quantitative', axis alt.Axis(title='#days')) 8 8).properties 9 width=150, 10 height=130 11 12 13 #gray background with selection 14 background = base.encode 15 color=alt.value('#ddd') ).add_selection(selection) 17 18 #blue highlights on the transformed data 19 highlight = base.transform_filter (selection) 20 line = alt.Chart().mark_rule(color='firebrick').encode 22 x=alt.X(alt.repeat('column'), aggregate='mean', type='quantitative'), 23 size=alt.SizeValue(3) ).transform_filter (selection) 25 26 #layer the three charts & repeat 27 group_chrt - alt.layer 28 background, 29 highlight, 30 20 line, 31 21 data-df 32 ) 33 22 34 alt.vconcat( 35 group_chrt.repeat (column=[ "Coal_MW", "Gas_MW", "Biomass_MW"]), 36 group_chrt.repeat (column=["Consumption_MW"]) 37 ) 38 Out[4] : 600 300 1,000 400 200 500 200 100 04 0 0 600,000 Coal_MW (binned), Mean of Coal_MW 0 160.000 320.000 Gas_MW (binned), Mean of Gas_MW 0 4.000 8,000 12,000 Biomass_MW (binned), Mean of Biomass_MW 1,000 800 600 #days 400 200 OTT 100,000 1,300,000 Consumption_MW (binned), Mean of Consumption_MW 600 300 1,000 400 200 Count of Records 500 200 100 0 600,000 Coal_MW (binned), Mean of Coal_MW 160,000 320,000 Gas_MW (binned), Mean of Gas_MW 0 4,000 8,000 12,000 Biomass_MW (binned), Mean of Biomass_MW 2,000 1,500 1,500 1,500 1,000 1,000 Count of Records 1,000 500 500 500 0- -50,000 150,000 350,000 Wind_MW (binned), Mean of Wind_MW -5,000 15,000 35,000 Solar_MW (binned), Mean of Solar_MW 0+ 20,000 100.000 180,000 Nuclear_MW (binned), Mean of Nuclear_MW 1,000 800 600 Count of Records 400- 200 0 100,000 1,300,000 Consumption_MW (binned), Mean of Consumption_MW In [2] : 1 import altair as alt 2 import pandas as pd 3 import numpy as np In [3]: 1 # data 2 df = pd. read_csv('daily_electricity.csv', index_col='Date') 3 df Out[3]: Consumption_MW Coal_MW Gas_MW Hidroelectric_MW Nuclear_MW Wind_MW Solar_MW Biomass_MW Production_MW Date 2010-01-03 874810.0 347240.0 153451.0 284290.0 87668.0 0.0 0.0 0.0 872639.0 2010-01-04 933653.0 262921.0 93664.0 372362.0 203503.0 0.0 0.0 0.0 932485.0 2010-01-05 765805.0 240812.0 34818.0 275409.0 205383.0 0.0 0.0 0.0 756438.0 2010-01-06 879815.0 366273.0 25326.0 405128.0 99650.0 0.0 0.0 0.0 896343.0 2010-01-07 883756.0 330657.0 40238.0 385101.0 200889.0 3813.0 0.0 0.0 960675.0 . .. 2017-12-30 990717.0 265775.0 222486.0 245874.0 205045.0 86549.0 6443.0 4954.0 1037076.0 2017-12-31 942634.0 241549.0 202973.0 192147.0 203591.0 145302.0 4934.0 4502.0 994966.0 2018-01-01 844500.0 222659.0 166553.0 195694.0 203426.0 63707.0 11358.0 4086.0 867443.0 2018-01-02 1169539.0 354447.0 270415.0 232071.0 202953.0 182412.0 21363.0 7974.0 1271623.0 2018-01-03 131951.0 43140.0 17365.0 26425.0 25282.0 40455.0 -18.0 807.0 153456.0 2922 rows x 9 columns In [4]: 2 3 4 ) 1 selection = alt.selection (type='single', encodings=[ 'x']) # Define the base chart, with the common parts of the # background and highlights base = alt. Chart().mark_bar().encode 6 x=alt.X(alt.repeat ("column), type=' quantitative', bin=alt.Bin (maxbins=20)), 7 y=alt.Y(aggregate='count', type='quantitative', axis alt.Axis(title='#days')) 8 8).properties 9 width=150, 10 height=130 11 12 13 #gray background with selection 14 background = base.encode 15 color=alt.value('#ddd') ).add_selection(selection) 17 18 #blue highlights on the transformed data 19 highlight = base.transform_filter (selection) 20 line = alt.Chart().mark_rule(color='firebrick').encode 22 x=alt.X(alt.repeat('column'), aggregate='mean', type='quantitative'), 23 size=alt.SizeValue(3) ).transform_filter (selection) 25 26 #layer the three charts & repeat 27 group_chrt - alt.layer 28 background, 29 highlight, 30 20 line, 31 21 data-df 32 ) 33 22 34 alt.vconcat( 35 group_chrt.repeat (column=[ "Coal_MW", "Gas_MW", "Biomass_MW"]), 36 group_chrt.repeat (column=["Consumption_MW"]) 37 ) 38 Out[4] : 600 300 1,000 400 200 500 200 100 04 0 0 600,000 Coal_MW (binned), Mean of Coal_MW 0 160.000 320.000 Gas_MW (binned), Mean of Gas_MW 0 4.000 8,000 12,000 Biomass_MW (binned), Mean of Biomass_MW 1,000 800 600 #days 400 200 OTT 100,000 1,300,000 Consumption_MW (binned), Mean of Consumption_MW
Step by Step Solution
There are 3 Steps involved in it

Get step-by-step solutions from verified subject matter experts