

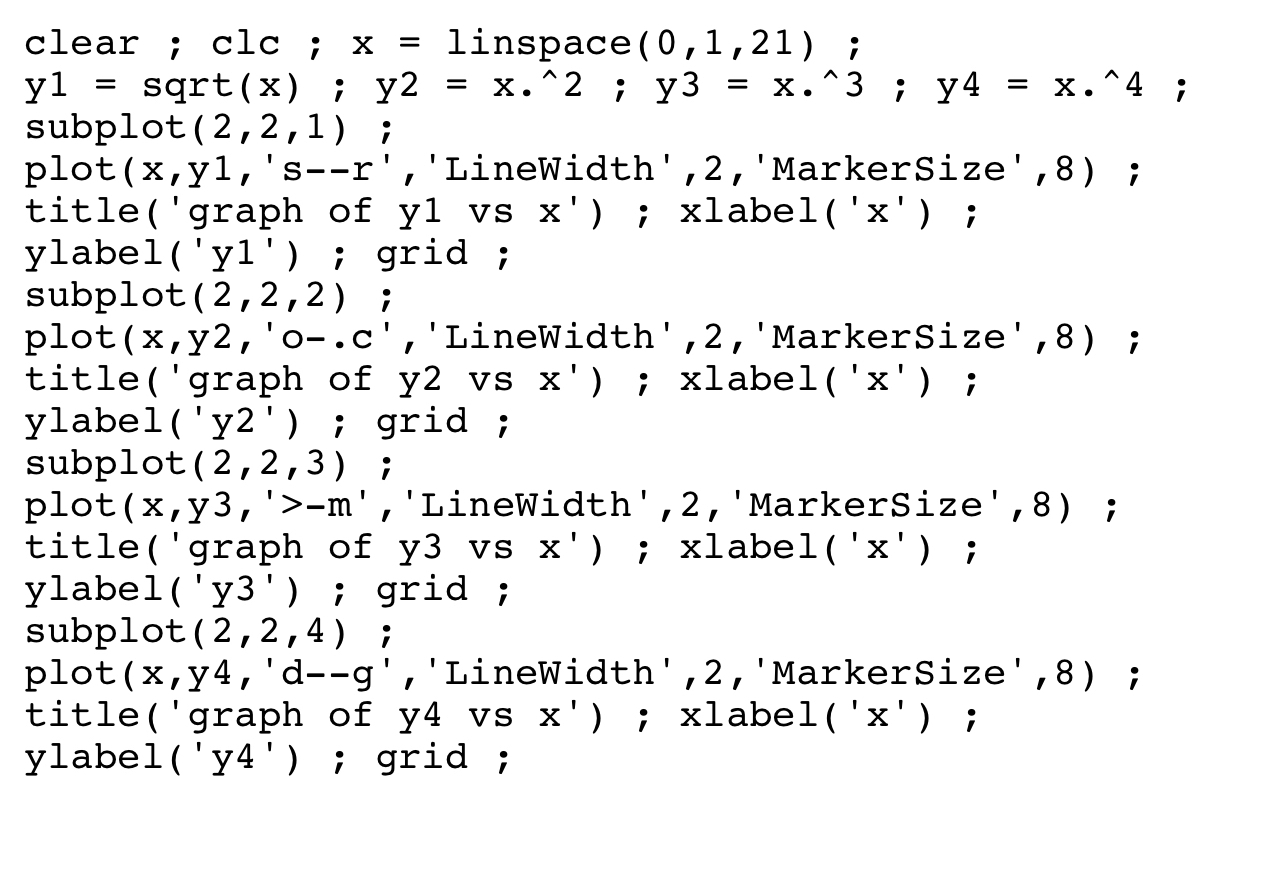
Question: Modify script g 5 . m so that it produces the following 4 graphs using the subplot option: ( a ) , y = s
Modify script gm so that it produces the following graphs using the subplot option:
a from to using points. Use dotted red line of width only without markers.
b from to using points. Use dashdot blue line of width only without markers.
c from to using points. Use solid green line of width without markers. The axis should be in degrees not radians
d from to using points. Use dotted black line of width only without markers. The axis should be in degrees not radians
Label the and axis appropriately for each of the cases. Also, add the function name in the title in each case.
Step by Step Solution
There are 3 Steps involved in it
1 Expert Approved Answer
Step: 1 Unlock

Question Has Been Solved by an Expert!
Get step-by-step solutions from verified subject matter experts
Step: 2 Unlock
Step: 3 Unlock