

Question: Modify the program from Lab 6 that displays the NYC historical population data. Your program should ask the user for the name of a borough
Modify the program from Lab 6 that displays the NYC historical population data. Your program should ask the user for the name of a borough and the name of the output file. The program should compute the minimum, maximum, average, median and standard deviation of the population of the borough entered by the user and then display the fraction of the population that has lived in that borough over time.
IMPORTANT: The grading script expects the new column to be called 'Fraction'
A sample run of the program:
Enter borough name: Brooklyn Enter output name: BrooklynFraction.png Min: 2017 Max: 2738175 Mean: 1252437.5384615385 Median: 1002564.5 Standard Deviation: 1153123.5551968655
The file BrooklynFraction.png: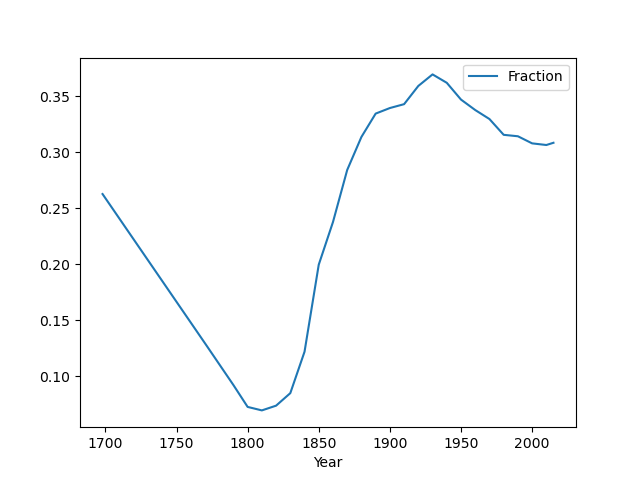
Note: before submitting your program for grading, remove the commands that show the image (i.e. the ones that pop up the graphics window with the image). The program is graded on a server on the cloud and does not have a graphics window, so, the plt.show() and plt.imshow() commands will give an error. Instead, the files your program produces are compared pixel-by-pixel to the answer to check for correctness. Python IDLE
Fraction 0.35 0.30 0.25 0.20 0.15 0.10 1700 1750 1800 1900 1950 2000 1850 Year
Step by Step Solution
There are 3 Steps involved in it

Get step-by-step solutions from verified subject matter experts