

Question: Module Three Homework Template - Excel Data Review View Cut = = Tell me what you want to do Wrap Test General Merge & Center
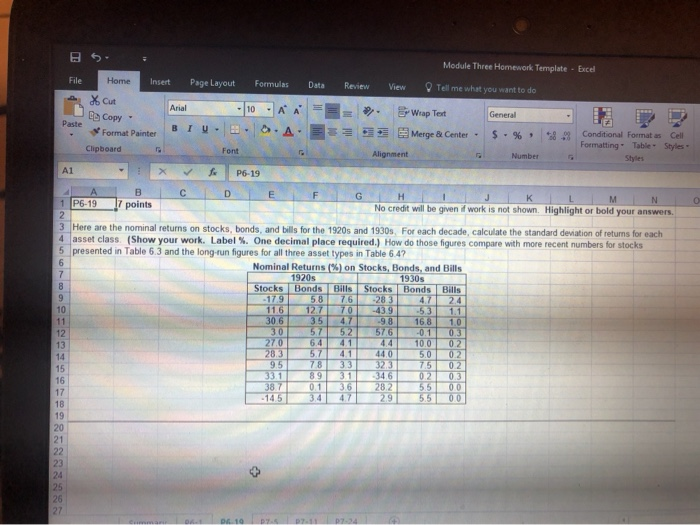
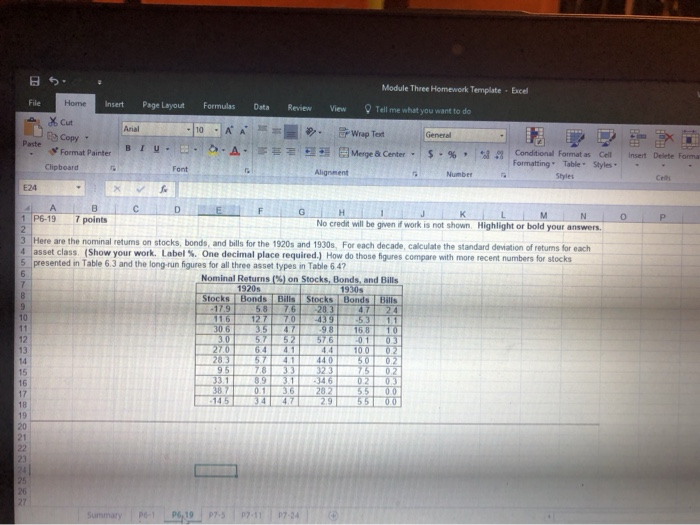
Module Three Homework Template - Excel Data Review View Cut = = Tell me what you want to do Wrap Test General Merge & Center - $ % 48.99 File Home Insert Page Layout Formulas Arial 10 A* C Copy Paste BIU Format Painter . S.A. Clipboard Font K P6-19 D E 1 P6-19 17 points 1 D D Conditional Format as Cell Formatting Table Styles Styles Alignment Number AI F G H I J K L M N No credit will be given if work is not shown. Highlight or bold your answers. O 3 Here are the nominal returns on stocks, bonds, and bills for the 1920s and 1930s. For each decade, calculate the standard deviation of returns for each 4 asset class. (Show your work. Label %. One decimal place required.) How do those figures compare with more recent numbers for stocks 5 presented in Table 6.3 and the long-run figures for all three asset types in Table 6.47 Nominal Returns (%) on Stocks, Bonds, and Bills 1920s 1930s Stocks Bonds Bills StocksBonds Bulls -17958762834724 116 127 70 -439 5 3 1.1 30. 6 35 4.7 -9.8 16.8 305752576 -0.1 0.3 270 | 64 4.1 10.0 02 44.0 95 32.3 283 alacca 38.7 28 Module Three Homework Template - Excel BS File Home e of cut Insert Page Layout Formulas Data Review View Tell me what you want to do Anal 2- Copy - 10-AA . Wrap Test Merge & Center - - IU. $ . % * Format Painter B Clipboard Conditional Formatas Cell Formatting Table Styles Styles Insert Delete Forma - - - Font Alignment Number E24 4 1 P6-197 points K L M N No credit will be given if work is not shown Highlight or bold your answers. O P 3 Here are the nominal retums on stocks, bonds and bills for the 1920s and 1930s. For each decade, calculate the standard deviation of returns for each 4 asset class. (Show your work. Label. One decimal place required.) How do those figures compare with more recent numbers for stocks 5 presented in Table 6.3 and the long-run figures for all three asset types in Table 6.4? Nominal Returns (%) on Stocks, Bonds, and Bills 1920s 1930s StocksBonds Bills StocksBonds Bills -17.9 5.8 76 283 4724 116 127 704395311 306 354798 16 8 10 301572576 0103 12/ 0644144 10.0 0.2 2831 57411 440 95 78331 33 1 8 9 3 .1 3870136 Febcaele NO 29 Summary P1 PS, 19 P7.5 2711
Step by Step Solution
There are 3 Steps involved in it

Get step-by-step solutions from verified subject matter experts