

Question: Monday, March 1 8 , 2 0 2 4 Control charts are used in the service industry to monitor services and help to determine how
Monday, March
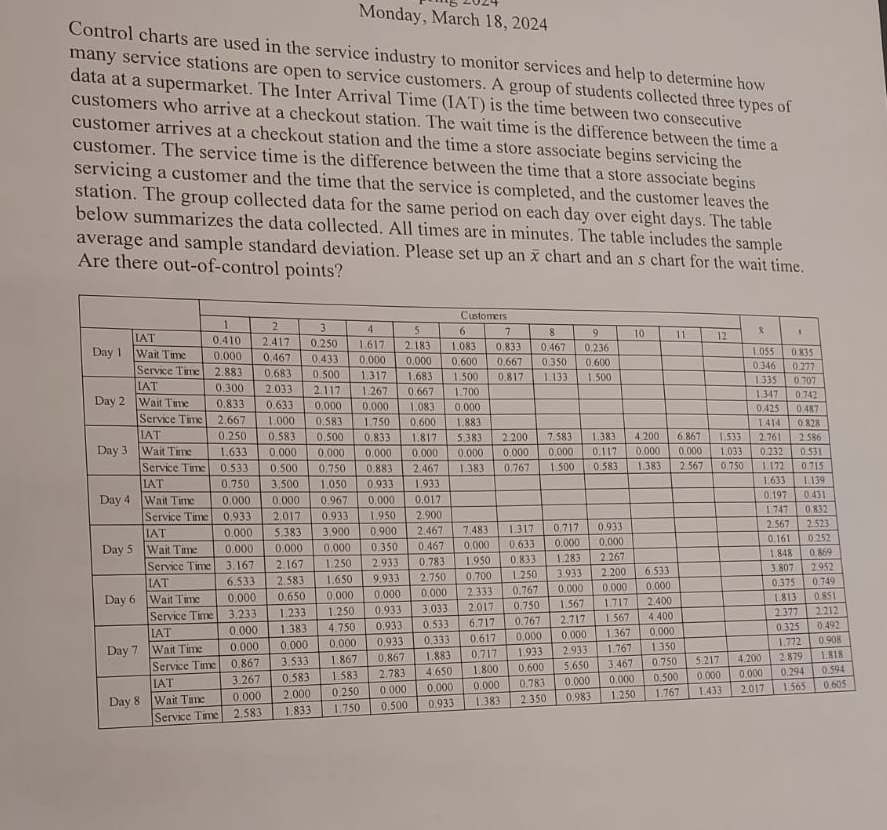
Control charts are used in the service industry to monitor services and help to determine how many service stations are open to service customers. A group of students collected three types of data at a supermarket. The Inter Arrival Time IAT is the time between two consecutive customers who arrive at a checkout station. The wait time is the difference between the time a customer arrives at a checkout station and the time a store associate begins servicing the customer. The service time is the difference between the time that a store associate begins servicing a customer and the time that the service is completed, and the customer leaves the station. The group collected data for the same period on each day over eight days. The table below summarizes the data collected. All times are in minutes. The table includes the sample average and sample standard deviation. Please set up an chart and an chart for the wait time. Are there outofcontrol points?
Step by Step Solution
There are 3 Steps involved in it
1 Expert Approved Answer
Step: 1 Unlock

Question Has Been Solved by an Expert!
Get step-by-step solutions from verified subject matter experts
Step: 2 Unlock
Step: 3 Unlock