

Question: Month / Yr . PERIOD PRICE AIP DIFF ADV DEMAND Jan. 2 2 1 6 . 1 5 . 8 - 0 . 3 6
MonthYr PERIOD PRICE AIP DIFF ADV DEMAND Jan.
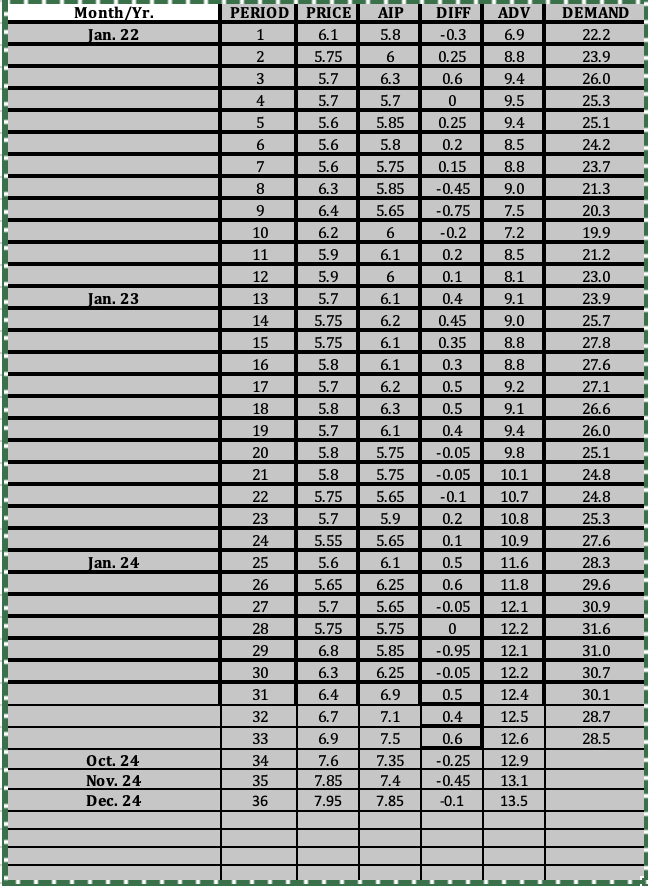
The Fresh Detergent Case
Enterprise Industries produces Fresh, a brand of liquid detergent. In order to more effectively
manage its inventory, the company would like to better predict demand for Fresh. To develop a
prediction model, the company has gathered data concerning demand for Fresh over the last
sales periods. Each sales period is defined as one month. The variables are as follows:
Demand Y demand for a large size bottle of Fresh in
Price the price of Fresh as offered by Ent. Industries
AIP the average industry price
ADV Ent. Industries Advertising Expenditure in $ to Promote Fresh in the sales
period.
DIFF AIP Price the "price difference" in the sales period
Download the data from Course Blackboard site into Excel spreadsheet.
Make time series scatter plots of all five variables five graphs Insert trend line, equation,
and Rsquared. Observe graphs and provide interpretation of results.
Construct scatter plots of Demand vs DIFF and Demand vs ADV, Demand vs AIP, and
Demand vs Price. Insert linear fitted line, equation, and Rsquared. Observe graphs and
provide interpretation. Note that Demand is always on the Y axis.
Obtain the correlation matrix for all six variables and rank the variables based on absolute
correlation with Demand. Explain your findings in plain language.
Use simple linear regression to perform trend analysis time period is X variable to predict
demand. Is trend analysis suitable for this data? Explain the Excel Regression output trend
equation, R RSquared, goodness of the model
Perform simple linear regression analysis with ADV as the independent variable to predict
demand. Write the equation and explain the Excel Regression output.
Repeat part with DIFF as the independent variable.
Construct multiple linear regression model with Period, AIP, DIFF, and ADV as
independent variables. Formulate the equation and explain the output. Rank variables based
on their degree of contribution to the model. Observe significant F Rsquared, and p
values and explain.
Perform multiple linear regression analysis with Period, DIFF, and ADV as independent
variables. Formulate the equation. Which variable is the most significant predictor of
demand? Rank the independent variables based on their degree of contribution to the
model. Observe significant F Rsquared, and pvalues and explain.
Use the model obtained in parts and make forecasts for the following months.
Period Price AIP ADV
Oct. $ $ $
Nov. $ $ $
Dec. $ $ $
Provide a brief conclusion based on above analysis
Step by Step Solution
There are 3 Steps involved in it
1 Expert Approved Answer
Step: 1 Unlock

Question Has Been Solved by an Expert!
Get step-by-step solutions from verified subject matter experts
Step: 2 Unlock
Step: 3 Unlock