

Question: MONTHLY RETURNS: BOEING (BA), Return for month ending BA WMT GE 1-Nov-2013 3.25% 1.97% 5.54% 1.67% 6.01% -2.29% 2-Dec-2013 2-Jan-2014 -8.23% -10.36% -5.10% 3-Feb-2014 3.50%
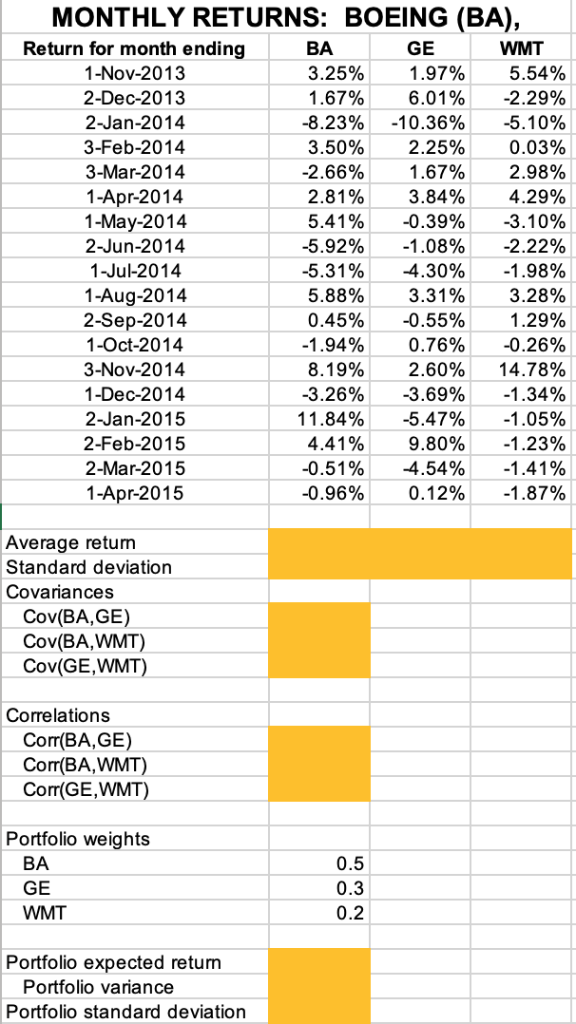

MONTHLY RETURNS: BOEING (BA), Return for month ending BA WMT GE 1-Nov-2013 3.25% 1.97% 5.54% 1.67% 6.01% -2.29% 2-Dec-2013 2-Jan-2014 -8.23% -10.36% -5.10% 3-Feb-2014 3.50% 2.25% 0.03% 3-Mar-2014 -2.66% 1.67% 2.98% 1-Apr-2014 2.81% 3.84% 4.29% 1-May-2014 5.41% -0.39% -3.10% 2-Jun-2014 -5.92% -1.08% -2.22% 1-Jul-2014 -5.31% -4.30% -1.98% 1-Aug-2014 5.88% 3.31% 3.28% 2-Sep-2014 0.45% -0.55% 1.29% 1-Oct-2014 -1.94% 0.76% -0.26% 3-Nov-2014 8.19% 2.60% 14.78% 1-Dec-2014 -3.26% -3.69% -1.34% 2-Jan-2015 11.84% -5.47% -1.05% 2-Feb-2015 4.41% 9.80% -1.23% 2-Mar-2015 -0.51% -4.54% -1.41% 1-Apr-2015 -0.96% 0.12% -1.87% Average retum Standard deviation Covariances Cov(BA, GE) Cov(BA,WMT) Cov(GE, Correlations Corr(BA,GE) Corr(BA,WMT) Corr(GE,WMT) Portfolio weights BA 0.5 GE 0.3 WMT 0.2 Portfolio expected return Portfolio variance Portfolio standard deviation Here are data on the stock prices and returns of General Electric (GE), Boeing (BA), and Walmart (WMT). Please fill in the blanks in the corresponding excel worksheet. MONTHLY RETURNS: BOEING (BA), Return for month ending BA WMT GE 1-Nov-2013 3.25% 1.97% 5.54% 1.67% 6.01% -2.29% 2-Dec-2013 2-Jan-2014 -8.23% -10.36% -5.10% 3-Feb-2014 3.50% 2.25% 0.03% 3-Mar-2014 -2.66% 1.67% 2.98% 1-Apr-2014 2.81% 3.84% 4.29% 1-May-2014 5.41% -0.39% -3.10% 2-Jun-2014 -5.92% -1.08% -2.22% 1-Jul-2014 -5.31% -4.30% -1.98% 1-Aug-2014 5.88% 3.31% 3.28% 2-Sep-2014 0.45% -0.55% 1.29% 1-Oct-2014 -1.94% 0.76% -0.26% 3-Nov-2014 8.19% 2.60% 14.78% 1-Dec-2014 -3.26% -3.69% -1.34% 2-Jan-2015 11.84% -5.47% -1.05% 2-Feb-2015 4.41% 9.80% -1.23% 2-Mar-2015 -0.51% -4.54% -1.41% 1-Apr-2015 -0.96% 0.12% -1.87% Average retum Standard deviation Covariances Cov(BA, GE) Cov(BA,WMT) Cov(GE, Correlations Corr(BA,GE) Corr(BA,WMT) Corr(GE,WMT) Portfolio weights BA 0.5 GE 0.3 WMT 0.2 Portfolio expected return Portfolio variance Portfolio standard deviation Here are data on the stock prices and returns of General Electric (GE), Boeing (BA), and Walmart (WMT). Please fill in the blanks in the corresponding excel worksheet
Step by Step Solution
There are 3 Steps involved in it

Get step-by-step solutions from verified subject matter experts