

Question: Moving to another question will save this response. Question 22 Use the figure below to answer the following question(s): Households Percentage of Income Received Quintile

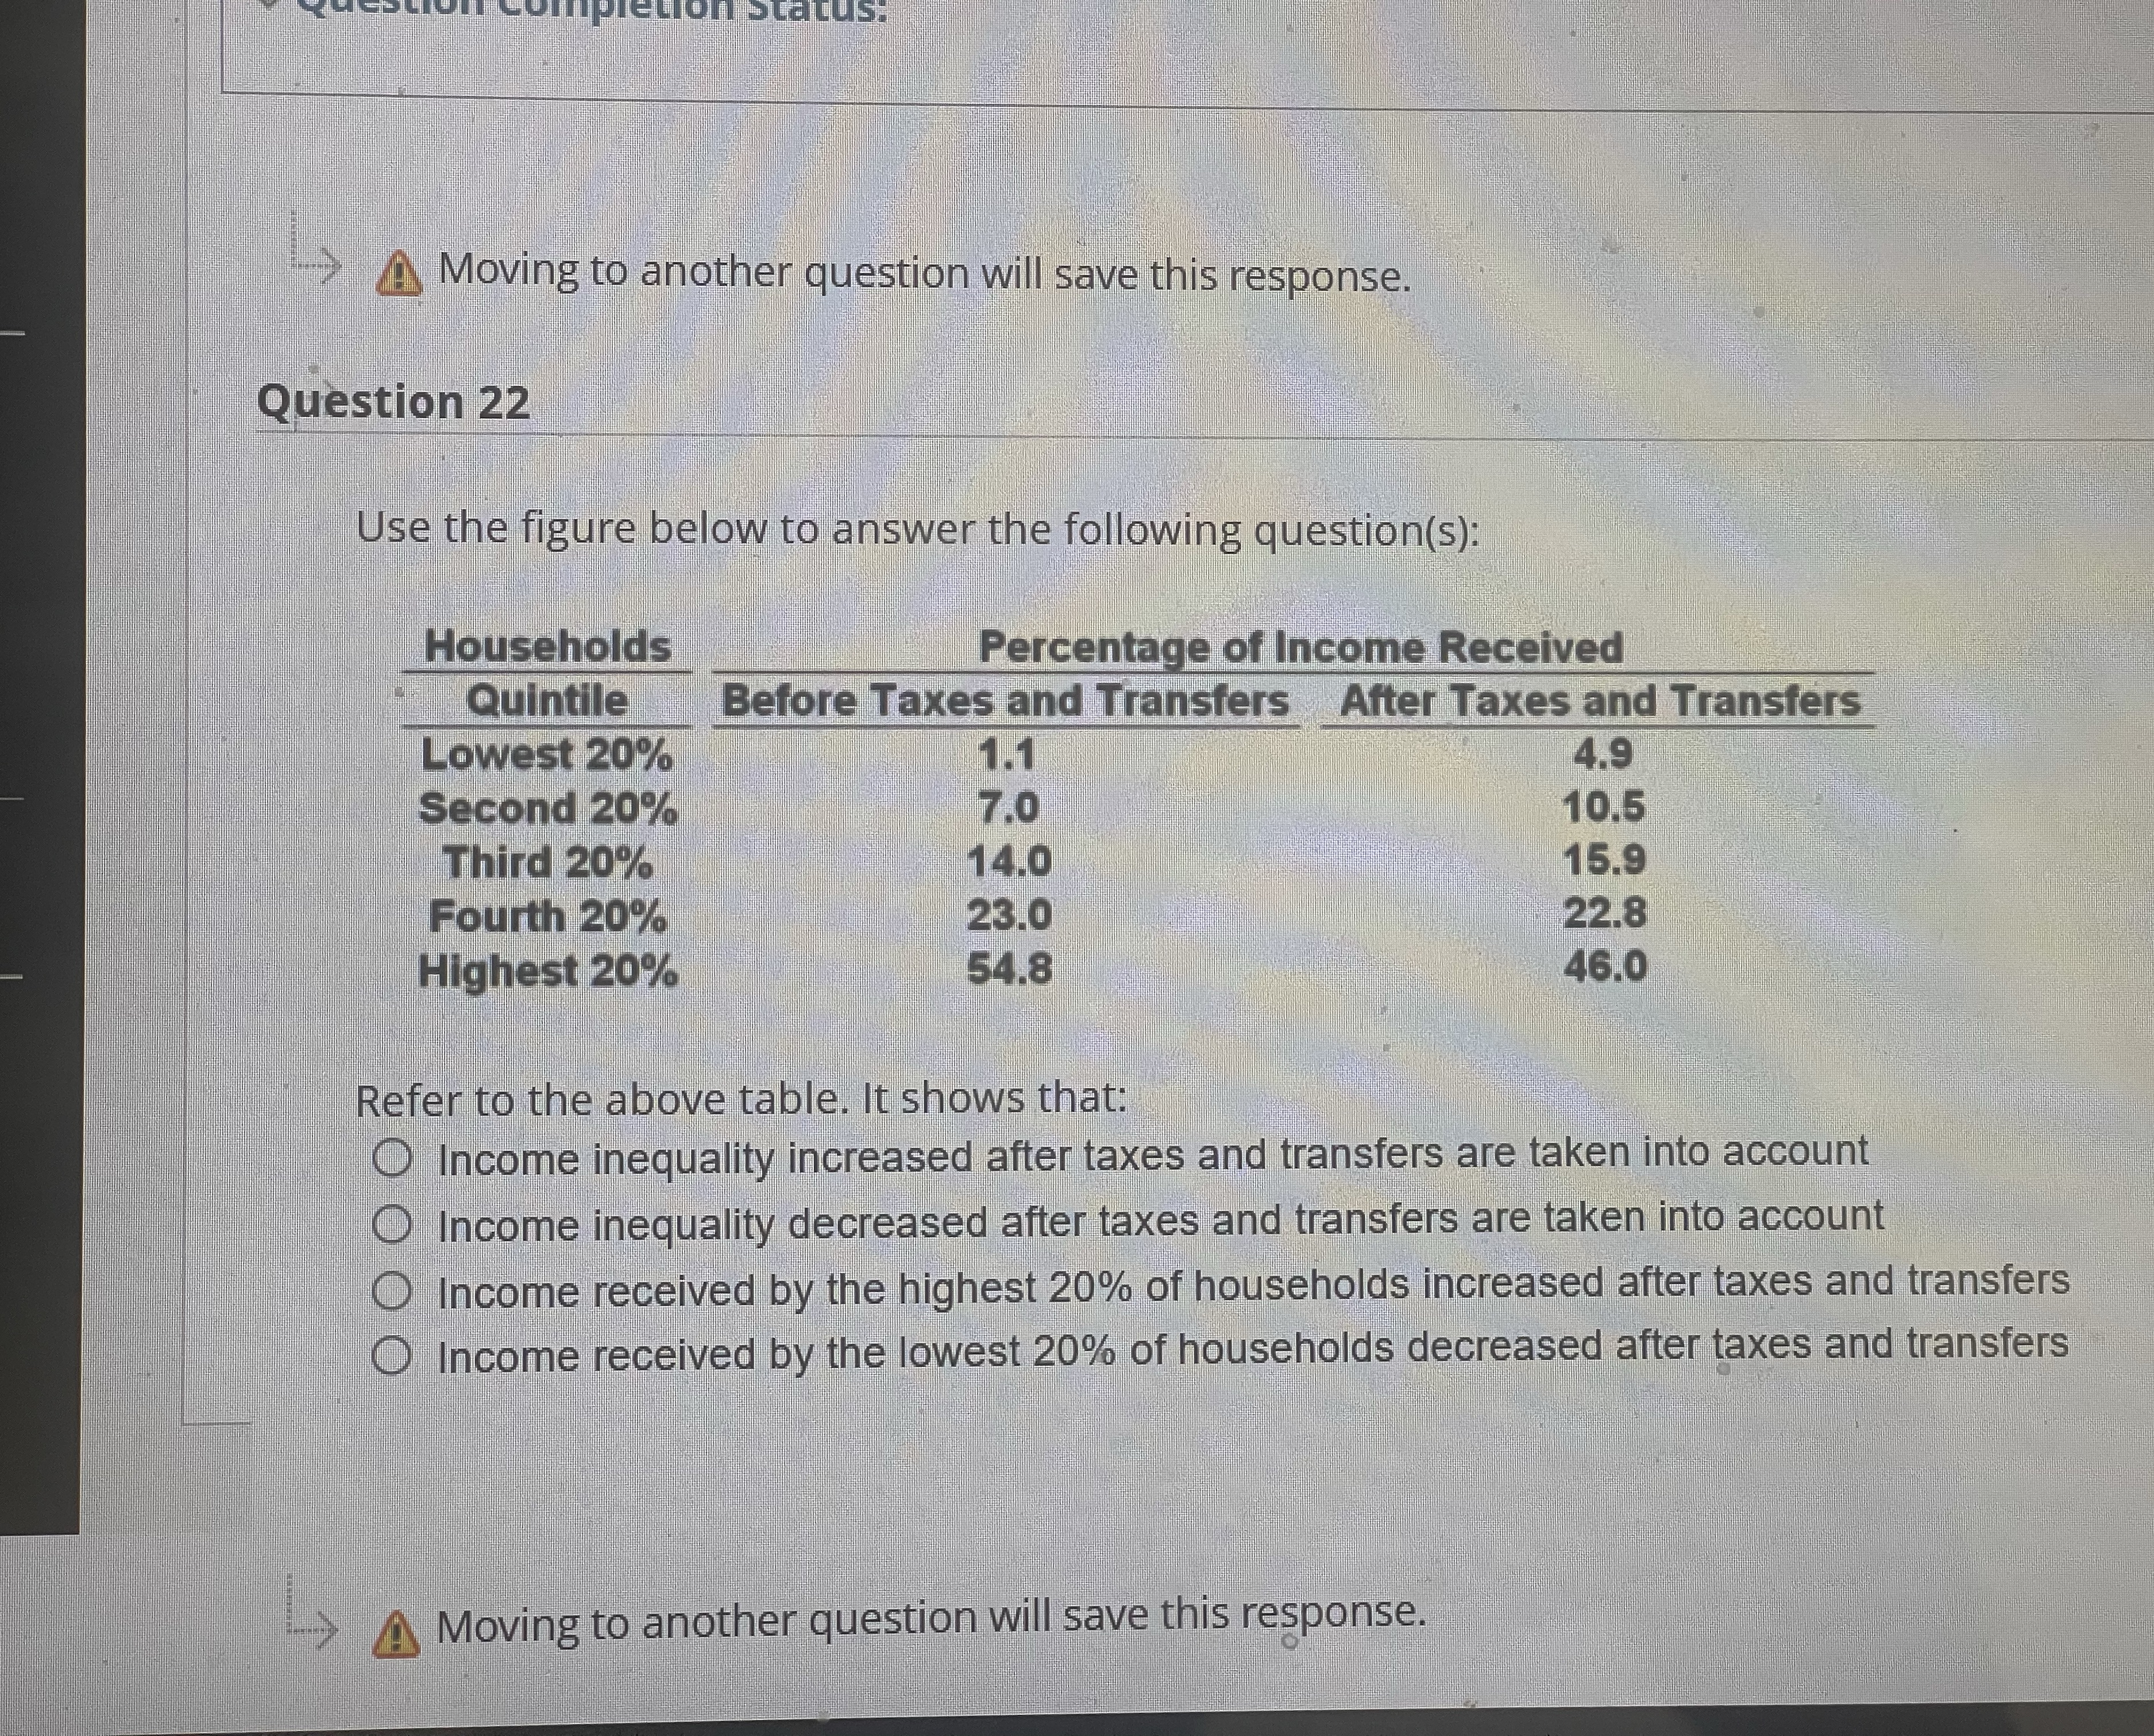
Moving to another question will save this response. Question 22 Use the figure below to answer the following question(s): Households Percentage of Income Received Quintile Before Taxes and Transfers After Taxes and Transfers Lowest 20% 1.1 4.9 Second 20% 7.0 10.5 Third 20% 14.0 15.9 Fourth 20% 23.0 22.8 Highest 20% 54.8 46.0 Refer to the above table. It shows that: Income inequality increased after taxes and transfers are taken into account Income inequality decreased after taxes and transfers are taken into account Income received by the highest 20% of households increased after taxes and transfers Income received by the lowest 20% of households decreased after taxes and transfers Moving to another question will save this response
Step by Step Solution
There are 3 Steps involved in it

Get step-by-step solutions from verified subject matter experts