Question: MPS-ATP FORMAT TABLE I NEED HELP WITH SECTION 2 ONLY PLEASE. Calculations and tables. Whenever Taylor Jones thought about going to work on Friday morning,
 MPS-ATP FORMAT TABLE
 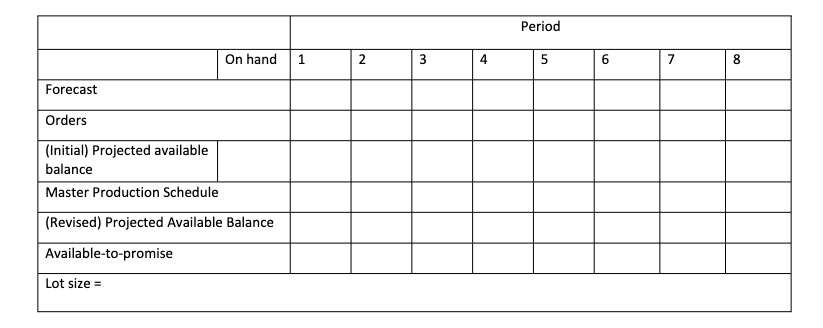 I NEED HELP WITH SECTION 2 ONLY PLEASE. Calculations and tables.
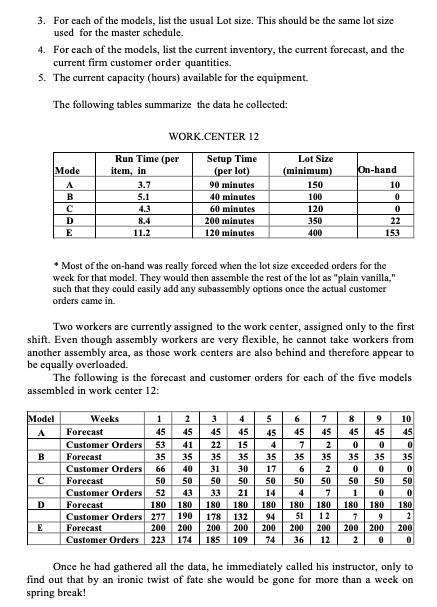
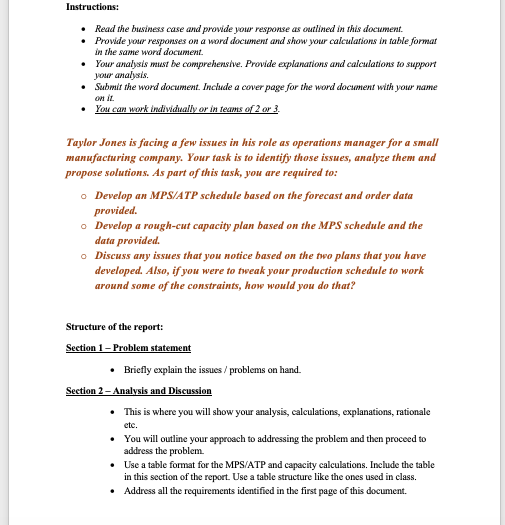
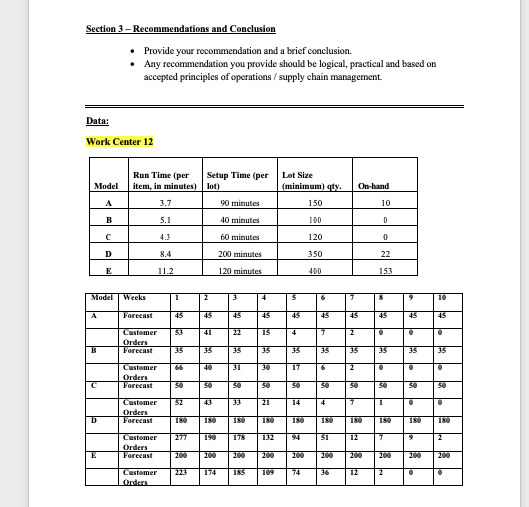
Whenever Taylor Jones thought about going to work on Friday morning, he started to get a little knot in his stomach. Taylor had recently accepted the job as operations manager for a small manufacturing company that specialized in a line of assemble-to- order products. When he accepted the job he was a recent graduate of a business program where he specialized in operations. He had done fairly well in his classes and had emerged as a confident, self-assured person who was sure he could handle such a job in a small company. The company, Murphy Products, had recently experienced rapid growth from the original start in a two-car garage just five years earlier. In fact, Taylor was the first person ever named as operations manager. Prior to that, the only production manager" reporting to the owner (Judy Murphy) was Frank Adams, the production supervisor. While Frank was an experienced supervisor, he had been promoted to supervisor directly from his old job as a machine operator and had no formal training in planning and control. He soon found that planning was too complex and difficult for him to handle, especially since he also had full responsibility for all the Murphy workers and equipment. Randy Stockard, the sales and marketing manager, had requested and finally applauded Judy Murphy's decision to hire Taylor, since he felt production was having a much more difficult time in promising and delivering customer orders. Randy was starting to spend more and more time on the phone with angry customers when they didn't get their orders at the time they expected them. The time away from developing new sales and the danger of losing established customers started to make him highly concerned about sustaining sales growth, to say nothing about his potential bonus check tied new sales! Once Taylor was placed in the position, however the "honeymoon" was short, and soon Taylor started doubting how much he really did know. The company was still having trouble with promising customer orders and having the capacity to meet those orders. At first he thought it was the forecasting method he used, but a recent analysis told him the total actual orders were generally within 10% of what the forecast projected. In addition, production never seemed to have any significant shortages in either subassemblies or components. In fact, many felt they bad far too much material, and in the last couple of staff meetings Jake Marris (the company controller) was grumbling that he thought the inventory turn ratio of just less than 3.5 was unreasonable and costing the company a lot of money. It must be something else, and he had to discover it quickly. The first idea he thought about was to request the assembly areas to work over- time, but he soon found out that was a sensitive topic that was to be used as a last resort. The workers in that area were highly skilled and would be difficult, if not impossible, to replace in any reasonable time. Adding more would also be difficult for the same reason. A year earlier they were being worked a lot of overtime but bad finally had enough. Even though Murphy had no union, the workers got together and demanded better overtime control or they would all quit to move to other jobs that were plentiful for skilled workers in this area. The agreement was that they were to be asked for no more than four hours of overtime per worker per week unless it was truly an emergency situation. They were well paid and all had families, and the time with their families was worth more to them than additional overtime pay. At least the high skill level had one advantage: Each of the workers in the assembly area could skillfully assemble any of the models, and the equipment each had was flexible enough to handle all the models. Friday mornings were when Taylor made his master schedule for the next week (since the standard lead time for all assemblies was quoted as one week, the company had felt no need to schedule farther into the future when very few orders existed there), and no matter how hard he tried he never seemed to be able to get it right. He was sure that he had to start the process by loading the jobs that were missed in the current week into the Monday and Tuesday time blocks and then hope that production could catch up with those in addition to the new jobs that were already promised. The promises came when Randy would inform him of a customer request and ask for a promise date-which was often "as soon as possible." Taylor would look at the order to see if the material to make it wasin stock and if the equipment to make it was running. He would then typically promise to have it available when requested. Now that a lot of promises were not being met, however, Randy was starting to demand that Jason "get control" of the operation. Taylor tried to respond by scheduling a lot of each model to be run every week, but be often found he had to break into the run of a lot to respond to expediting from sales. He knew this made matters worse by using extra time to set up the equipment, but what else could he do? Even Judy Murphy was asking him what she needed to do to help him improve the performance. His normal high level of self-confidence was being shaken. Taylor started pouring over his old operations book looking for something he could use. He finally realized that what he needed was a more effective system to develop master schedules from which he could promise orders, order components, and plan capacity. Unfortunately, he also recalled that when that material was covered in his class he had taken off early for spring break! Even though he knew enough to recognize the nature of the problem, he didn't know enough to set up such a schedule. Humbly, he called his former instructor to ask for advice. Once she was briefed on the problem, she told him to gather some information that he could use to develop a sample master schedule and rough-cut capacity plan. Once he had the information, she would help show him how to use it. The following describes what she asked him to collect: 1. Pick a work center or piece of equipment that has caused some capacity problem in the recent past. List all the product models that use that work center. 2. For each of the models, list the amount of run time they use the work center per item. Also list the setup time, if any. These times can be gathered from standards or, if the standard data are suspect in their accuracy or do not exist, use the actual average time from recent production. 3. For each of the models, list the usual Lot size. This should be the same lot size used for the master schedule. 4. For each of the models, list the current inventory, the current forecast, and the current firm customer order quantities. 5. The current capacity (hours) available for the equipment. The following tables summarize the data he collected: WORK.CENTER 12 Lot Size (minimum) 150 Mode B D E Run Time (per item, in 3.7 5.1 4.3 8.4 11.2 Setup Time (per lot) 90 minutes 40 minutes 60 minutes 200 minutes 120 minutes 100 120 350 400 On-hand 10 0 0 22 153 * Most of the on-hand was really forced when the lot size exceeded orders for the week for that model. They would then assemble the rest of the lot as "plain vanilla," such that they could easily add any subassembly options once the actual customer orders came in Two workers are currently assigned to the work center, assigned only to the first shift. Even though assembly workers are very flexible, he cannot take workers from another assembly area, as those work centers are also behind and therefore appear to be equally overloaded. The following is the forecast and customer orders for each of the five models assembled in work center 12: Model A 2 45 41 35 40 50 Weeks 1 Forecast 45 Customer Orders 53 Forecast 35 Customer Orders 66 Forecast 50 Customer Orders 52 Forecast 180 Customer Orders 277 Forecast 200 Customer Orders 223 3 45 22 35 31 50 B 4 45 15 35 30 50 21 180 132 200 109 5 45 4 35 17 50 14 6 45 7 35 6 50 4 180 7 45 2 35 2 50 7 3 = = = = = = = 8 45 0 35 0 50 1 180 9 45 0 35 0 50 0 180 9 200 0 10 45 0 35 0 50 0 180 2 200 0 D 180 180 180 190 200 180 178 200 185 E 94 200 74 200 36 12 200 12 200 2 174 Once he had gathered all the data, he immediately called his instructor, only to find out that by an ironic twist of fate she would be gone for more than a week on spring break! Instructions: Read the business case and provide your response as outlined in this document. Provide your responses on a word document and show your calculations in table format in the same word document. Your analysis must be comprehensive. Provide explanations and calculations to support your analysis Submit the word document. Include a cover page for the word document with your name on it. You can work individually or in teams of 2 or 3. Taylor Jones is facing a few issues in his role as operations manager for a small manufacturing company. Your task is to identify those issues, analyze them and propose solutions. As part of this task, you are required to: Develop an MPS/ATP schedule based on the forecast and order data provided. o Develop a rough-cut capacity plan based on the MPS schedule and the data provided. o Discuss any issues that you notice based on the two plans that you have developed. Also, if you were to tweak your production schedule to work around some of the constraints, how would you do that? Structure of the report: Section 1 - Problem statement Briefly explain the issues / problems on hand. Section 2 - Analysis and Discussion This is where you will show your analysis, calculations, explanations, rationale etc. You will outline your approach to addressing the problem and then proceed to address the problem Use a table format for the MPS/ATP and capacity calculations. Include the table in this section of the report. Use a table structure like the ones used in class. Address all the requirements identified in the first page of this document. Section 3 - Recommendations and Conclusion Provide your recommendation and a brief conclusion Any recommendation you provide should be logical, practical and based on accepted principles of operations / supply chain management. Data: Work Center 12 Run Time (per Setup Time (per item, in minutes) lot) Model Lot Size (minimum) aty On-hand A 3.7 90 minutes 150 10 B 5.1 40 minutes 100 D 60 minutes 120 0 D 8.4 200 minutes 350 22 E 11.2 120 minutes 400 153 Model Weeks 1 2 3 4 5 6 7 3 10 A Forecast 45 45 45 45 45 45 45 45 45 45 50 41 22 15 4 7 2 0 Customer Orders Forecast 35 35 35 35 35 66 40 31 30 17 6 2 . Customer Orders Forecast C SO SO so SO 13. 50 so SO 52 33 21 4 7 1 . Customer Orders Forecast D 180 180 180 180 180 180 180 180 180 180 190 73 132 94 12 7 9 2 Customer Orders Forecast E 200 200 200 200 200 200 200 200 200 223 74 Customer Onders 36 12 2 Period On hand 1 3 4 6 7 8 Forecast Orders (Initial) Projected available balance Master Production Schedule (Revised) Projected Available Balance Available-to-promise Lot size =


