

Question: Name: Graphing Lab - How Far Around? Purpose: To determine the relationship between radius, area and circumference using different sized round objects. Materials: -
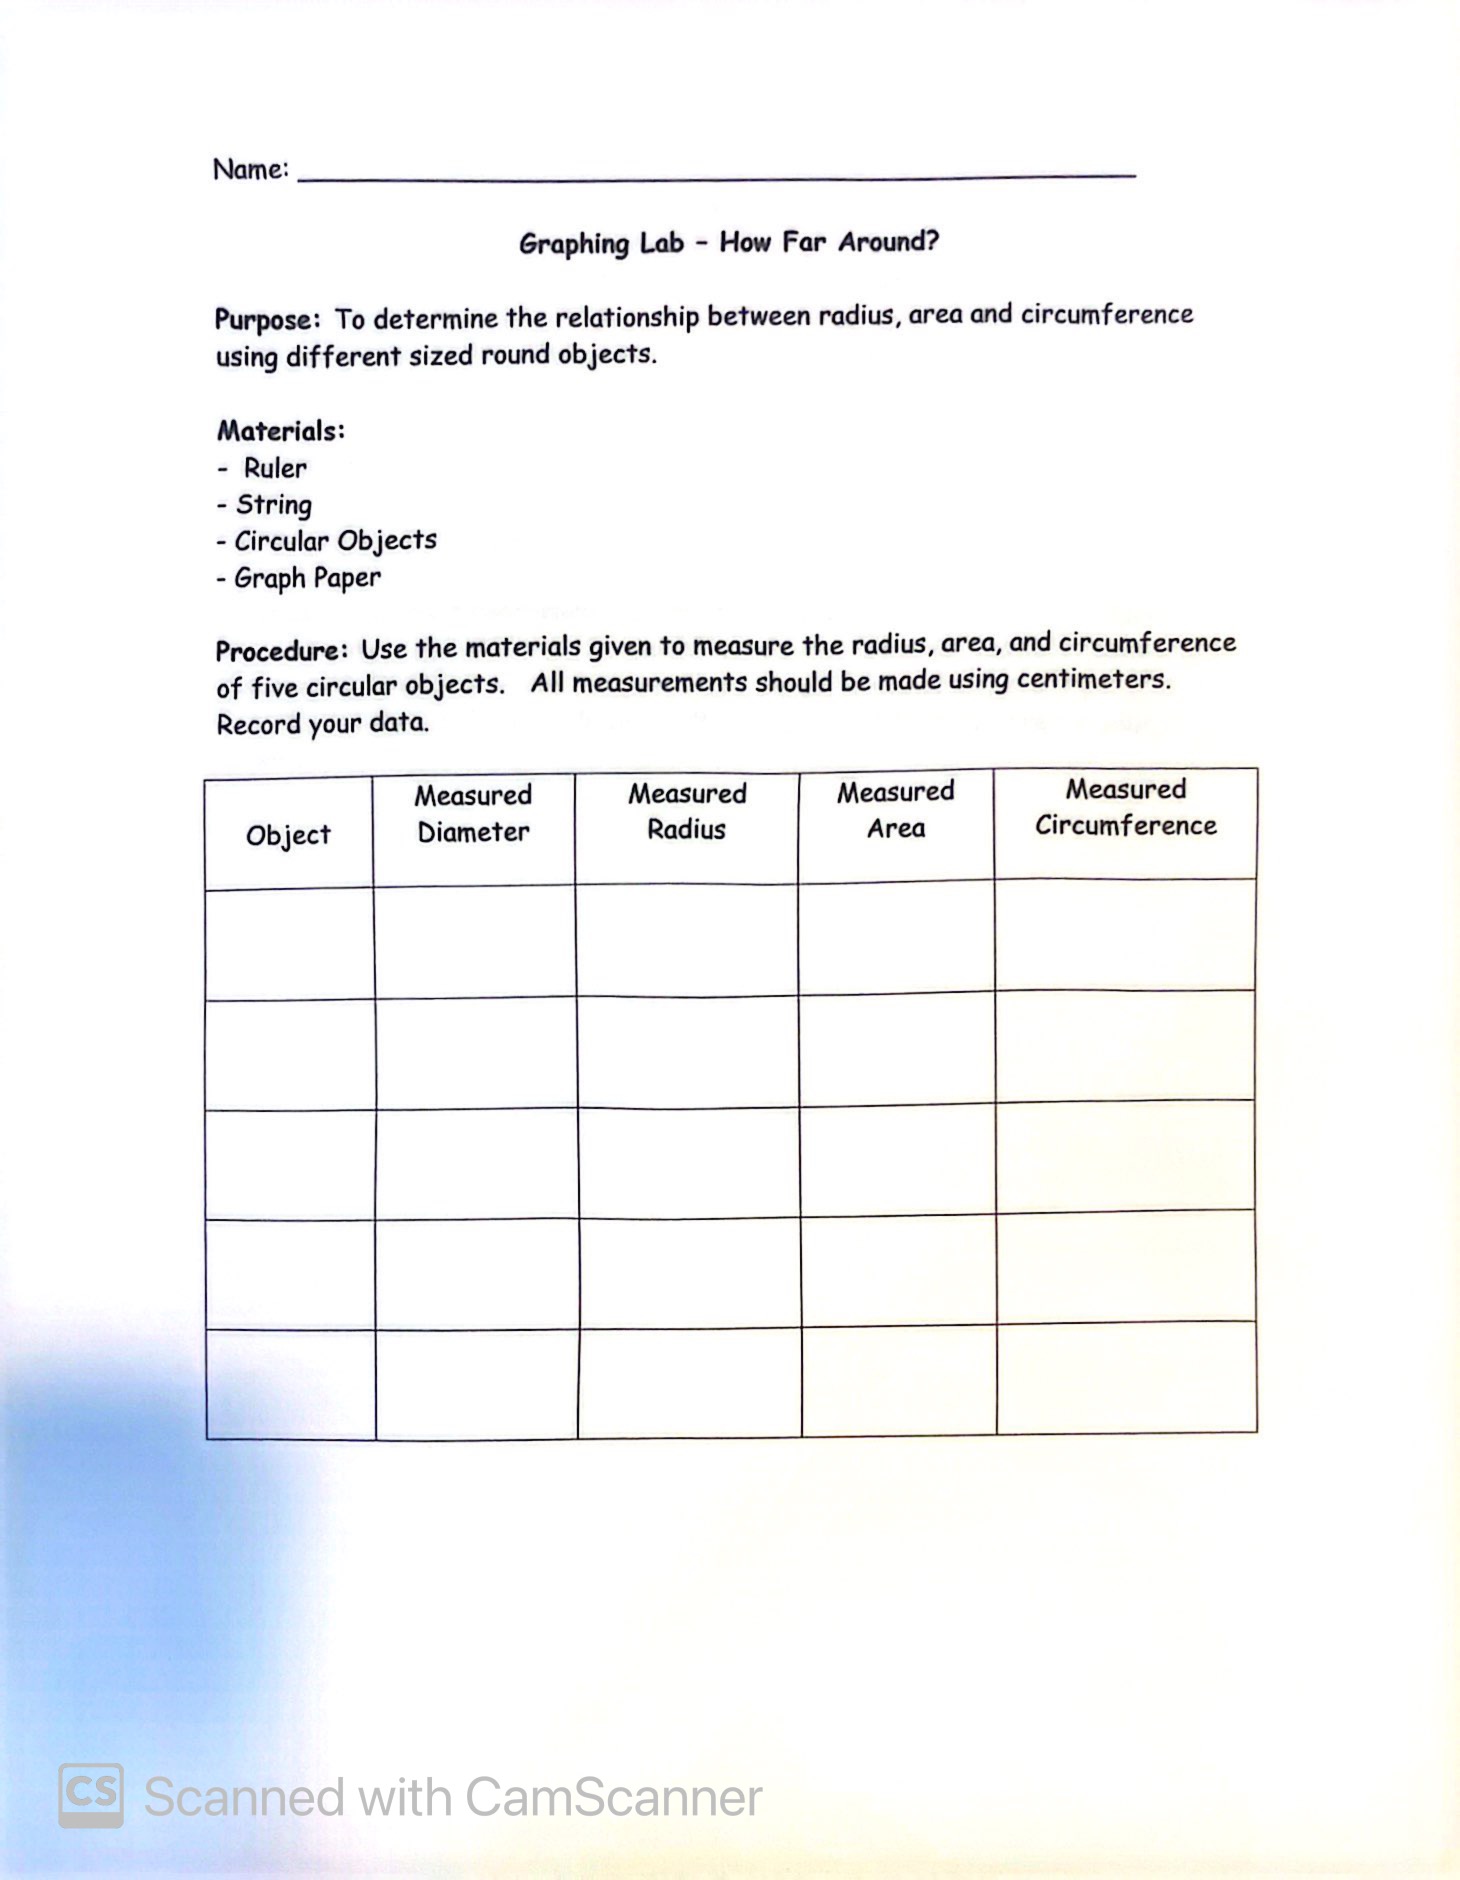
Name: Graphing Lab - How Far Around? Purpose: To determine the relationship between radius, area and circumference using different sized round objects. Materials: - Ruler - String - Circular Objects - Graph Paper Procedure: Use the materials given to measure the radius, area, and circumference of five circular objects. All measurements should be made using centimeters. Record your data. Object Measured Diameter Measured Radius Measured Area Measured Circumference CS Scanned with CamScanner Graphs: - Radius (x-axis) versus the circumference (y-axis) - Radius (x-axis) versus the area (y-axis) Plot all your data points from the table. Graph each data set until the graphs appear straight. Make sure to include a title for your graph, labeled and numbered axes, and a best fit line. Calculate the slope of your graph by hand, if graphed by hand. Percent Error: What should the value of the slope be theoretically for each graph? Determine the percent error of your results with the theoretical result. Conclusion: Write a conclusion that summarizes your findings. Your conclusion should be in paragraph form. It should include, but is not limited to, relationships discovered, as well as values for your slope, actual values of slope, and percent errors. You should also include where this error might have occurred in your experiment. CS Scanned with CamScanner
Step by Step Solution
There are 3 Steps involved in it

Get step-by-step solutions from verified subject matter experts