

Question: Name: Period: Date: Example 3: Given the following data, construct a box and whisker plot: (10 points) 3, 3, 5, 7, 1, 10, 10, 4,
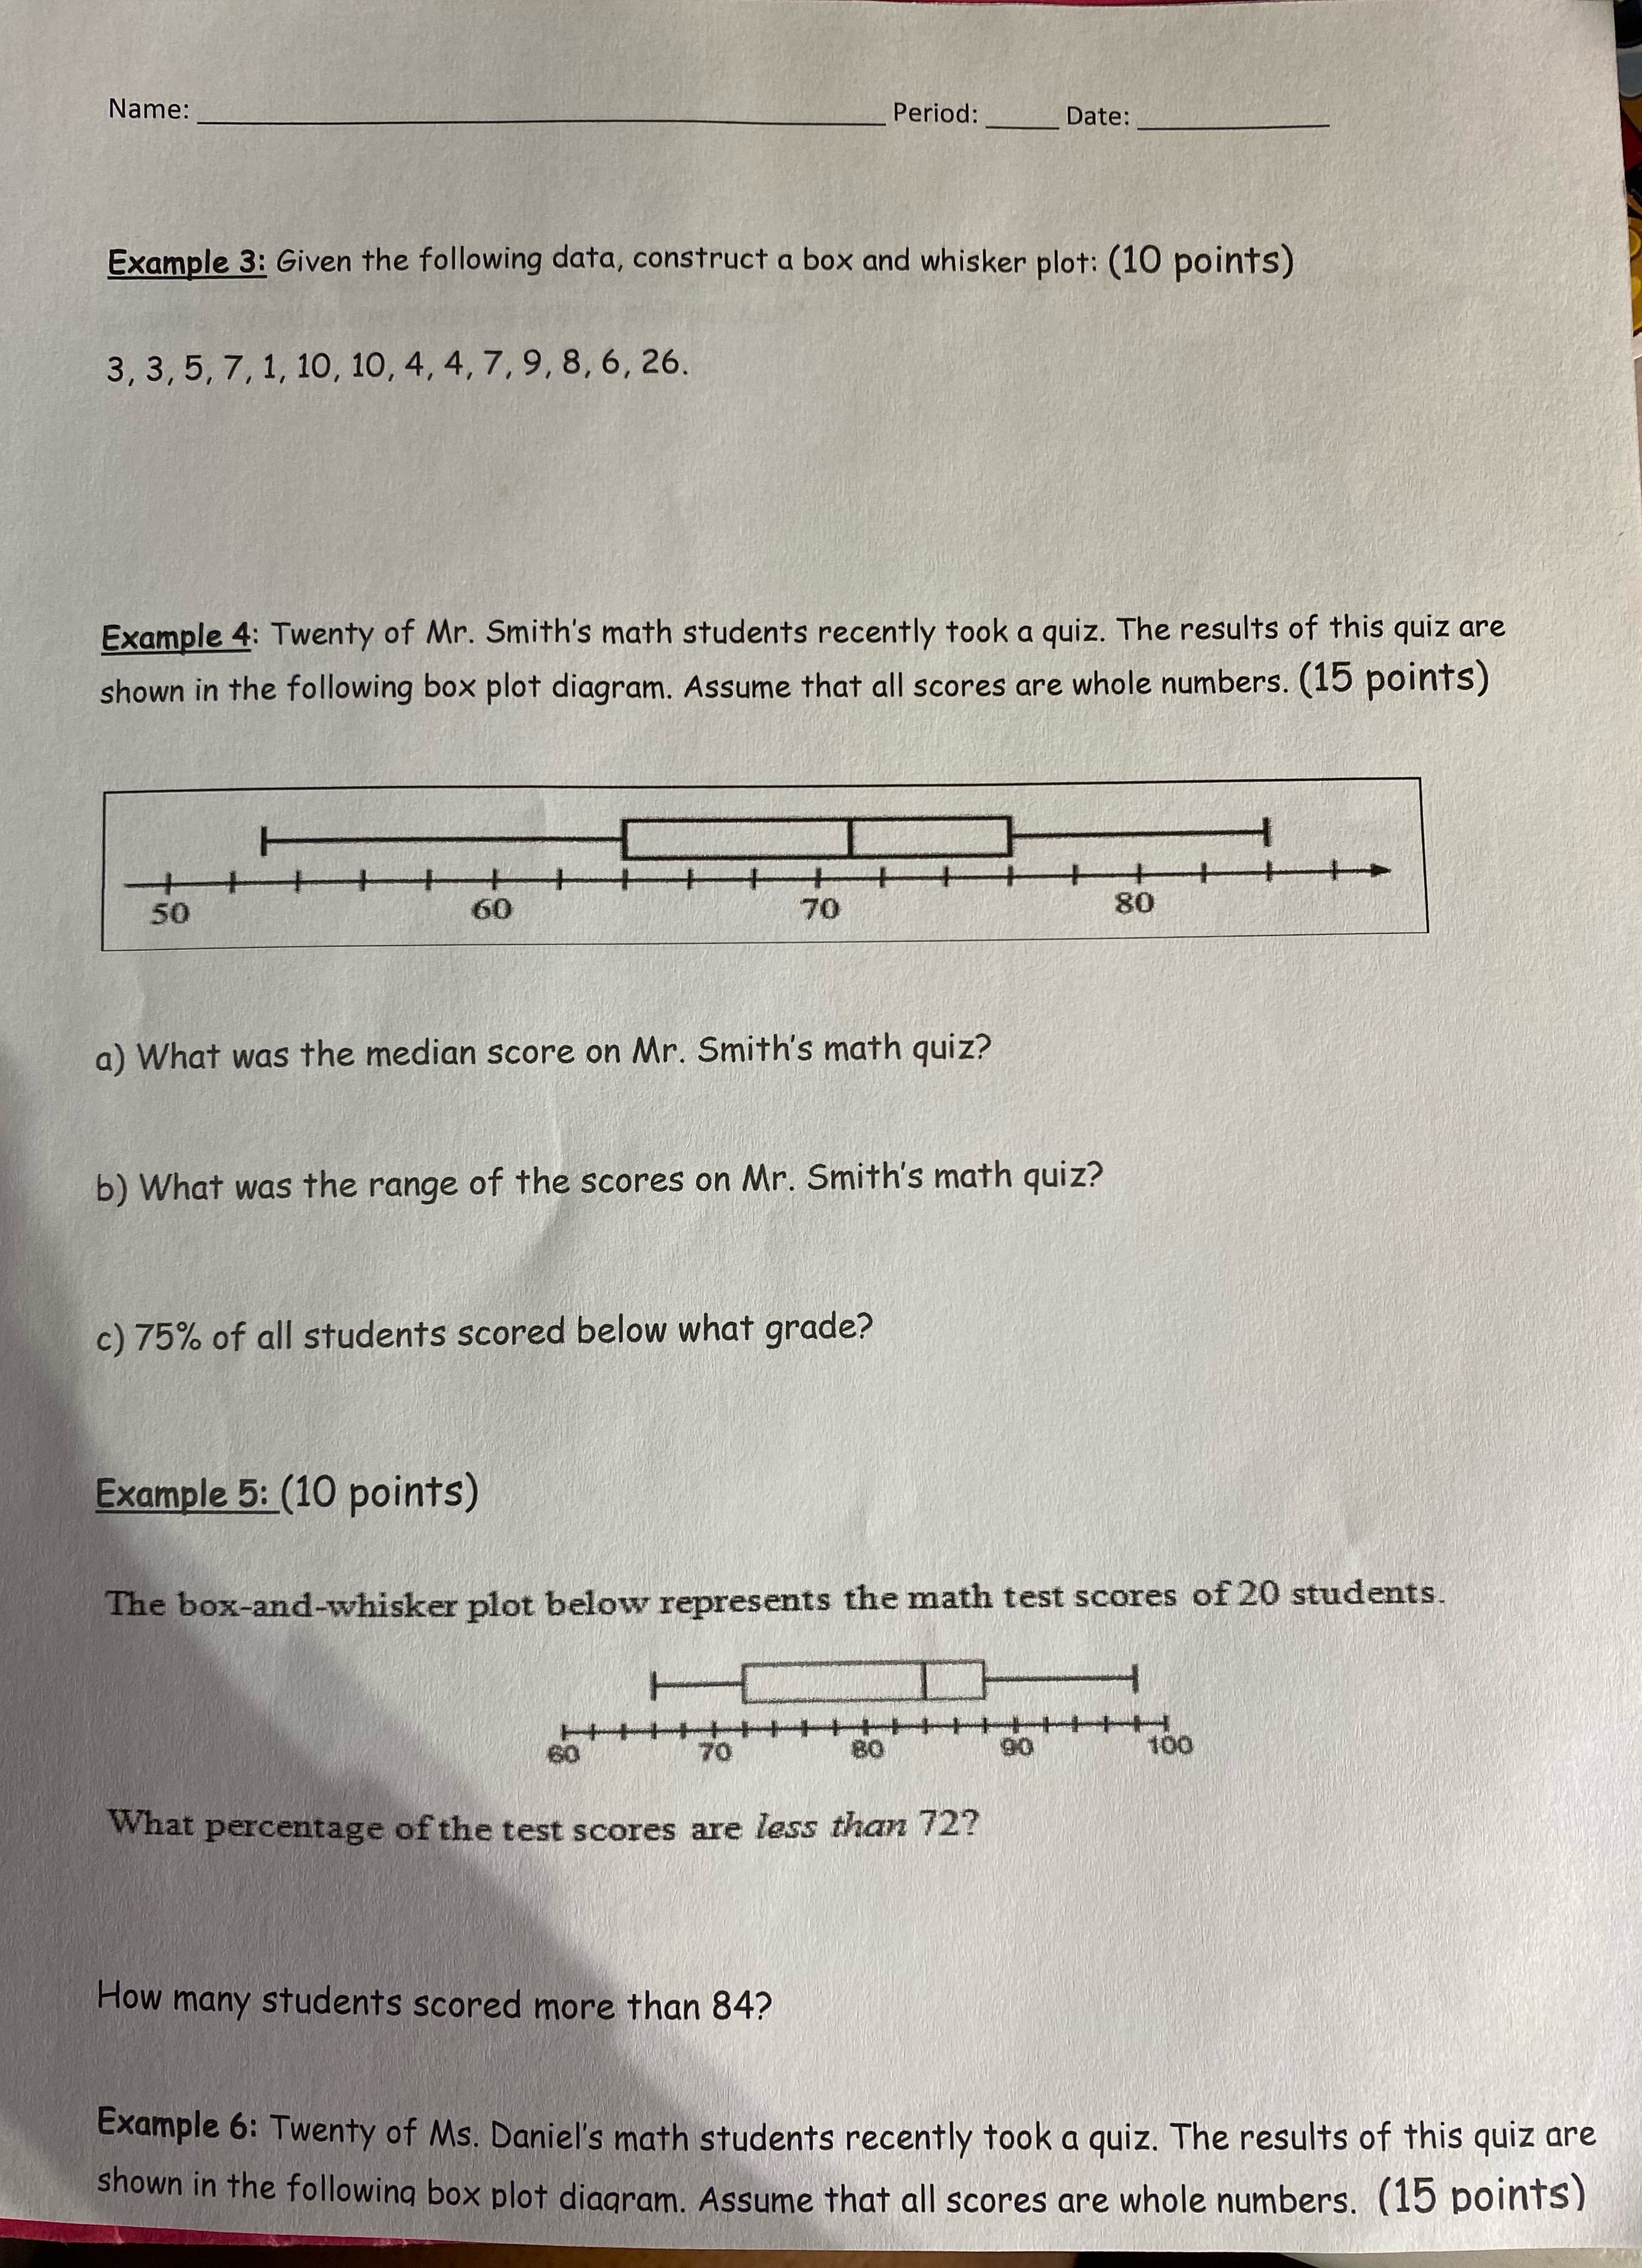
Name: Period: Date: Example 3: Given the following data, construct a box and whisker plot: (10 points) 3, 3, 5, 7, 1, 10, 10, 4, 4, 7, 9, 8, 6, 26. Example 4: Twenty of Mr. Smith's math students recently took a quiz. The results of this quiz are shown in the following box plot diagram. Assume that all scores are whole numbers. (15 points) 50 80 a) What was the median score on Mr. Smith's math quiz? b) What was the range of the scores on Mr. Smith's math quiz? c) 75% of all students scored below what grade? Example 5: (10 points) The box-and-whisker plot below represents the math test scores of 20 students. 100 What percentage of the test scores are less than 72? How many students scored more than 84? Example 6: Twenty of Ms. Daniel's math students recently took a quiz. The results of this quiz are shown in the following box plot diagram. Assume that all scores are whole numbers. (15 points)
Step by Step Solution
There are 3 Steps involved in it

Get step-by-step solutions from verified subject matter experts